2023 School Accountability Report Card Page 1 of 23 Miramonte High School
Miramonte High School
2022-2023 School Accountability Report Card
(Published During the 2023-2024 School Year)
---- ---
2023 School Accountability Report Card
General Information about the School Accountability Report Card (SARC)
SARC Overview
By February 1 of each year, every school in California is required by state law to
publish a School Accountability Report Card (SARC). The SARC contains
information about the condition and performance of each California public school.
Under the Local Control Funding Formula (LCFF) all local educational agencies
(LEAs) are required to prepare a Local Control and Accountability Plan (LCAP),
which describes how they intend to meet annual school-specific goals for all pupils,
with specific activities to address state and local priorities. Additionally, data
reported in an LCAP is to be consistent with data reported in the SARC.
- For more information about SARC requirements and access to prior year
reports, see the California Department of Education (CDE) SARC web page at
https://www.cde.ca.gov/ta/ac/sa/.
- For more information about the LCFF or the LCAP, see the CDE LCFF web
page at https://www.cde.ca.gov/fg/aa/lc/.
- For additional information about the school, parents/guardians and community
members should contact the school principal or the district office.
2023 School Accountability Report Card Page 2 of 23 Miramonte High School
DataQuest
DataQuest is an online data tool located on the CDE DataQuest web page at
https://dq.cde.ca.gov/dataquest/ that contains additional information about this
school and comparisons of the school to the district and the county. Specifically,
DataQuest is a dynamic system that provides reports for accountability (e.g., test
data, enrollment, high school graduates, dropouts, course enrollments, staffing,
and data regarding English learners).
California School Dashboard
The California School Dashboard (Dashboard)
https://www.caschooldashboard.org/ reflects California’s new accountability and
continuous improvement system and provides information about how LEAs and
schools are meeting the needs of California’s diverse student population. The
Dashboard contains reports that display the performance of LEAs, schools, and
student groups on a set of state and local measures to assist in identifying
strengths, challenges, and areas in need of improvement.
Internet Access
Internet access is available at public libraries and other locations that are publicly
accessible (e.g., the California State Library). Access to the Internet at libraries and
public locations is generally provided on a first-come, first-served basis. Other use
restrictions may include the hours of operation, the length of time that a workstation
may be used (depending on availability), the types of software programs available
on a workstation, and the ability to print documents.
2023-24 School Contact Information
2023-24 School Contact Information
School Name
Miramonte High School
Street
750 Moraga Way
City, State, Zip
Orinda, CA 94563-4330
Phone Number
(925) 280-3930
Principal
Ben Campopiano
Email Address
School Website
https://www.acalanes.k12.ca.us/miramonte/
County-District-School (CDS) Code
07616300000000
2023-24 District Contact Information
2023-24 District Contact Information
District Name
Acalanes Union High School District
Phone Number
(925) 280-3900
Superintendent
John Nickerson, Ed.D
Email Address
District Website
www.acalanes.k12.ca.us
2023-24 School Description and Mission Statement
2023-24 School Description and Mission Statement
Miramonte High School, located in Orinda, California, was founded in 1955 and is a Western Association of Schools and
Colleges accredited school. Miramonte has been recognized as a Gold Ribbon School and is routinely acknowledged by US
News & World Report in their ranking of the Best High Schools in the state and country. Miramonte is committed to providing
rigorous academics, a safe learning environment, and opportunities for students to build successful relationships with adults
and peers. Our rich and varied curriculum ensures an optimum learning experience for each student. Participation in a broad
2023 School Accountability Report Card Page 3 of 23 Miramonte High School
2023-24 School Description and Mission Statement
range of activities, including academic classes, visual and performing arts, sports, and volunteer opportunities develops our
students into well-rounded citizens ready to build a stronger community.
MISSION:
Miramonte High School aspires to provide a supportive, engaging, and equitable environment to help students become positive
contributors to our world community.
MOTTO:
GO MATS!
Go Mindfully, Authentically, Together, and Serve
SCHOOLWIDE LEARNER OUTCOMES:
Miramonte High School graduates will be:
Learners who:
Demonstrate proficiency of curricular standards and essential skills
Maintain a growth-mindset to improve and develop, particularly when challenged
Engage in learning opportunities to not only expand their future opportunities, but to improve their personal development
Communicators who:
Listen objectively and empathetically
Express themselves effectively and creatively
Utilize reliable evidence to support their ideas and claims
Collaborators who:
Solve problems cooperatively with others
Demonstrate inclusivity, empathy, and compassion
Welcome and explore ideas from multiple perspectives
Citizens who:
Engage actively and positively in local and global community initiatives
Respect and are intentionally inclusive of the diversity and perspective of others
Demonstrate responsible behavior and work to maintain their well-being
--------
About this School
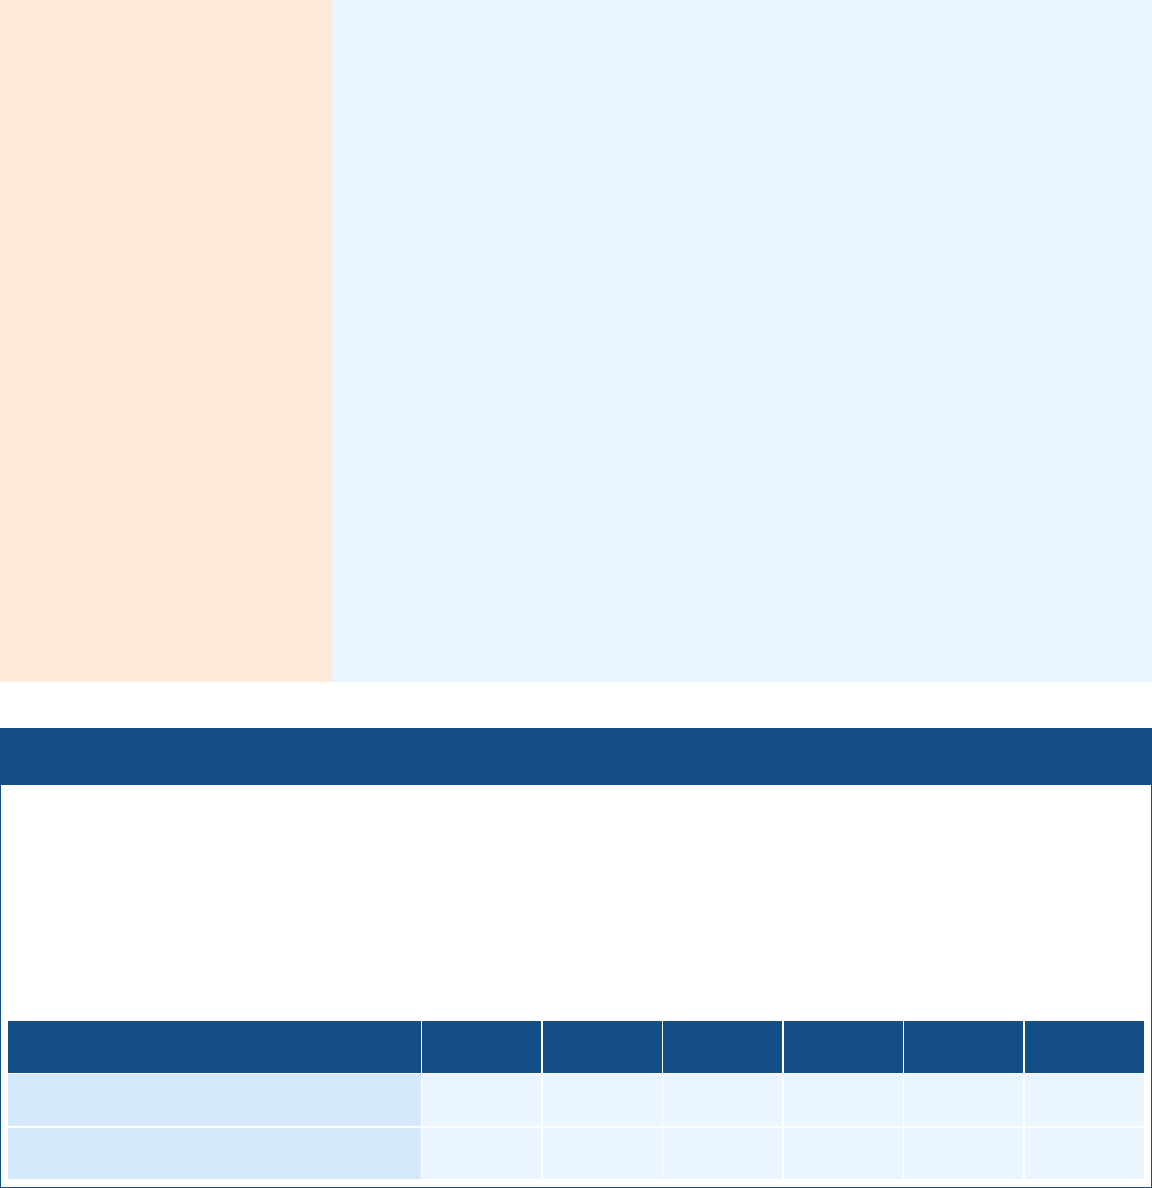
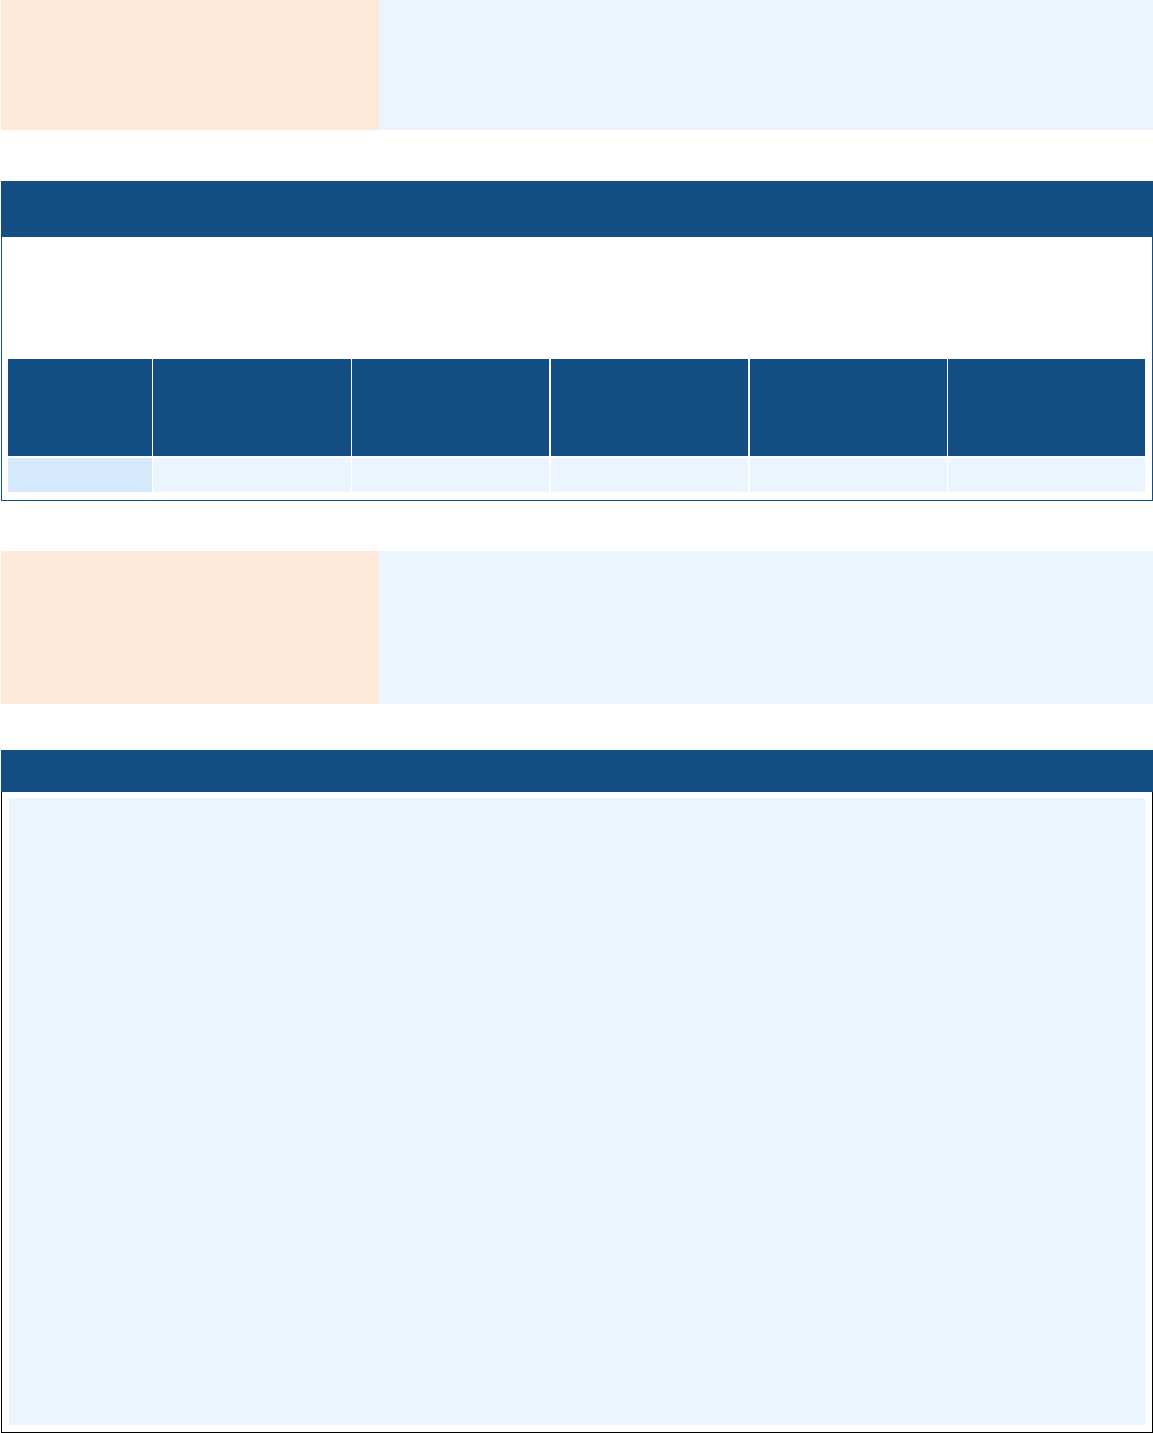
2023-24 Student Enrollment by Grade Level
2022-23 Student Enrollment by Grade Level
Grade Level
Number of Students
Grade 9
296
Grade 10
306
Grade 11
289
Grade 12
278
Total Enrollment
1,169
2023 School Accountability Report Card Page 4 of 23 Miramonte High School
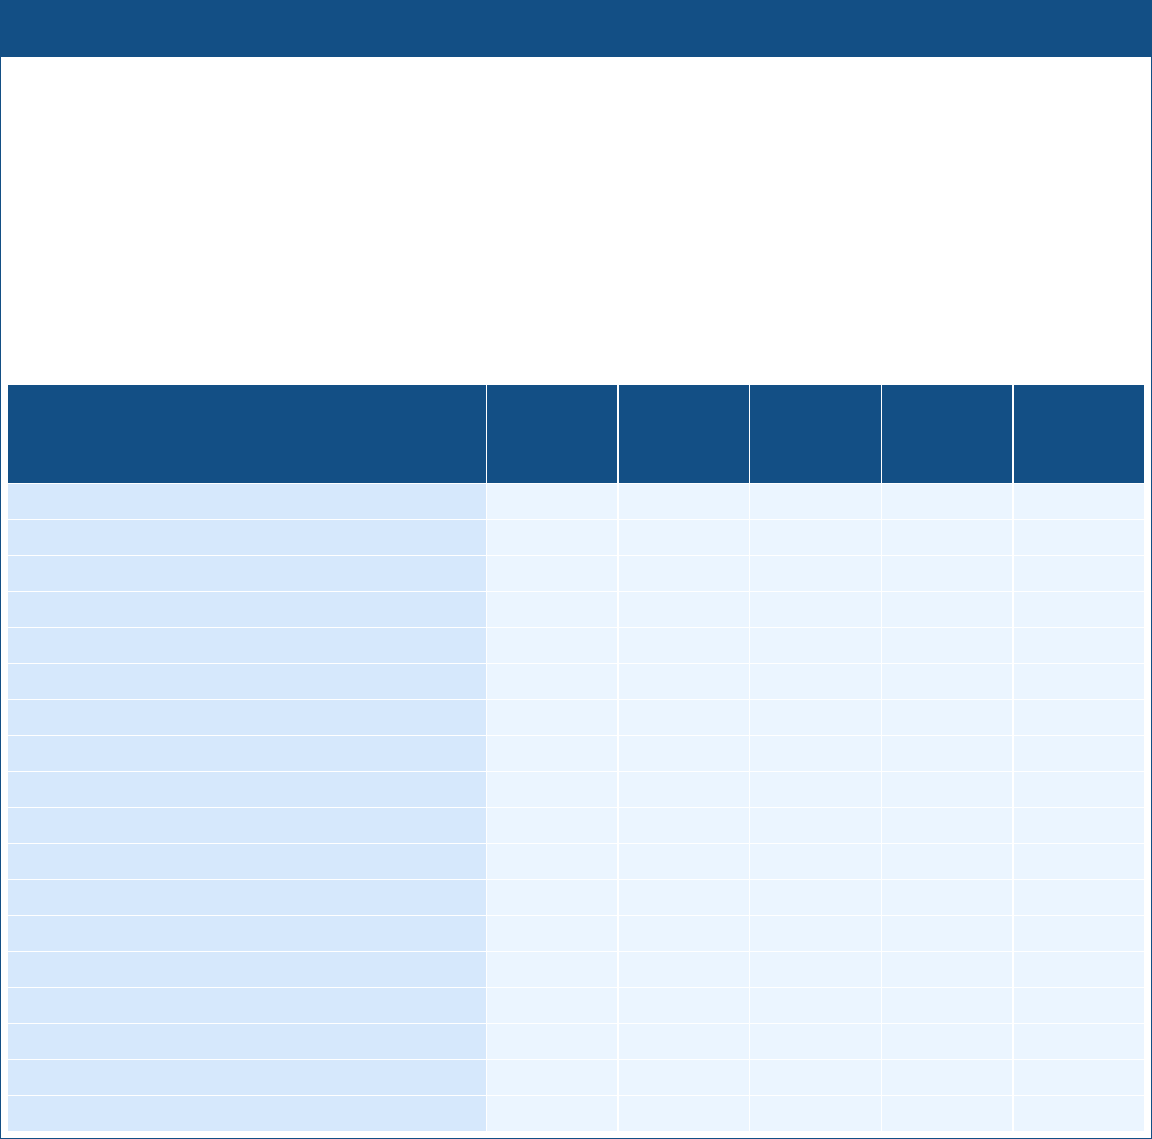
2023-24 Student Enrollment by Student Group
2022-23 Student Enrollment by Student Group
Student Group
Percent of Total Enrollment
Female
48.4%
Male
51.2%
American Indian or Alaska Native
0.3%
Asian
22.2%
Black or African American
1.2%
Filipino
1.6%
Hispanic or Latino
8%
Native Hawaiian or Pacific Islander
0.1%
Two or More Races
5.3%
White
59.9%
English Learners
0.5%
Foster Youth
0.1%
Homeless
0.1%
Socioeconomically Disadvantaged
5.2%
Students with Disabilities
11.2%
A. Conditions of Learning (State Priority: Basic)
A. Conditions of Learning
State Priority: Basic
The SARC provides the following information relevant to the State priority: Basic
(Priority 1):
• Degree to which teachers are appropriately assigned and fully credentialed in the
subject area and for the pupils they are teaching;
• Pupils have access to standards-aligned instructional materials; and
• School facilities are maintained in good repair
2023 School Accountability Report Card Page 5 of 23 Miramonte High School
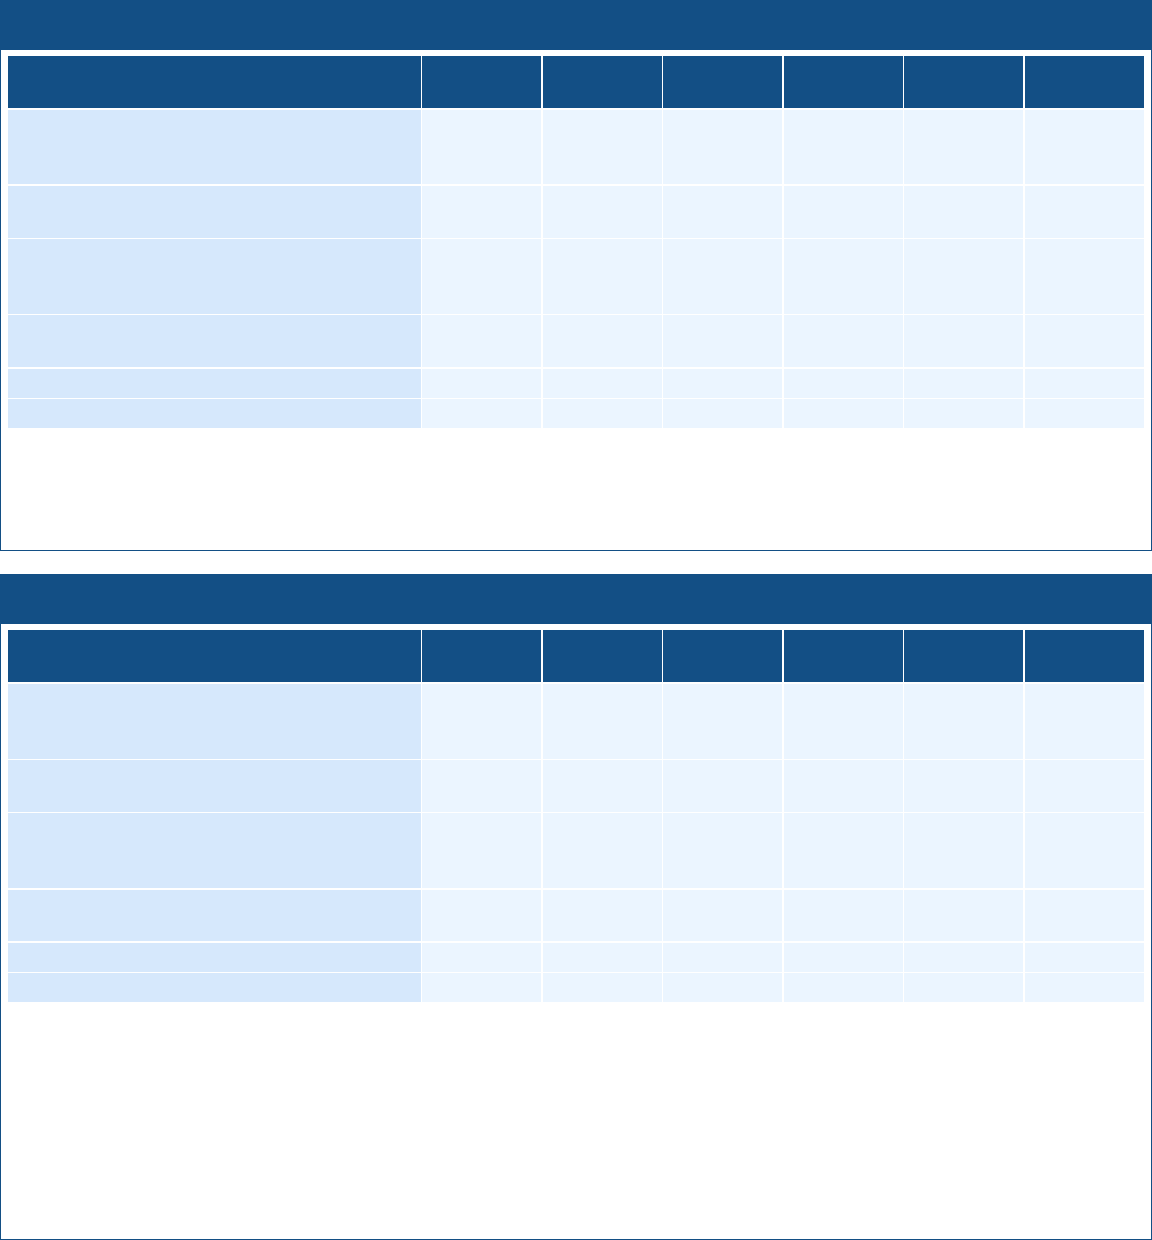
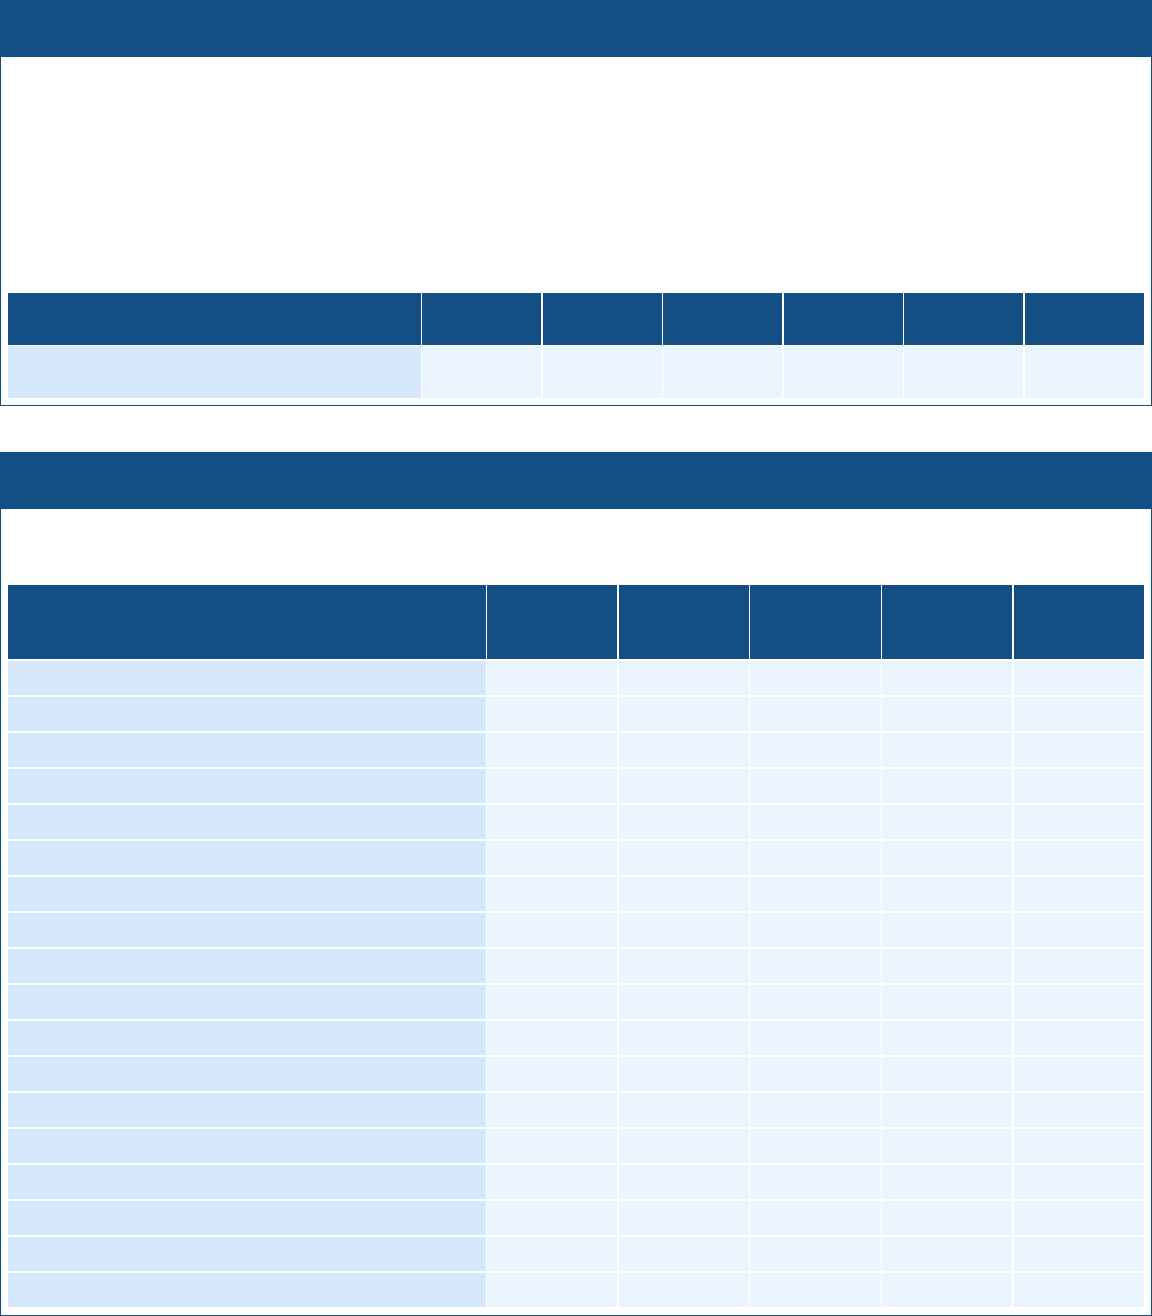
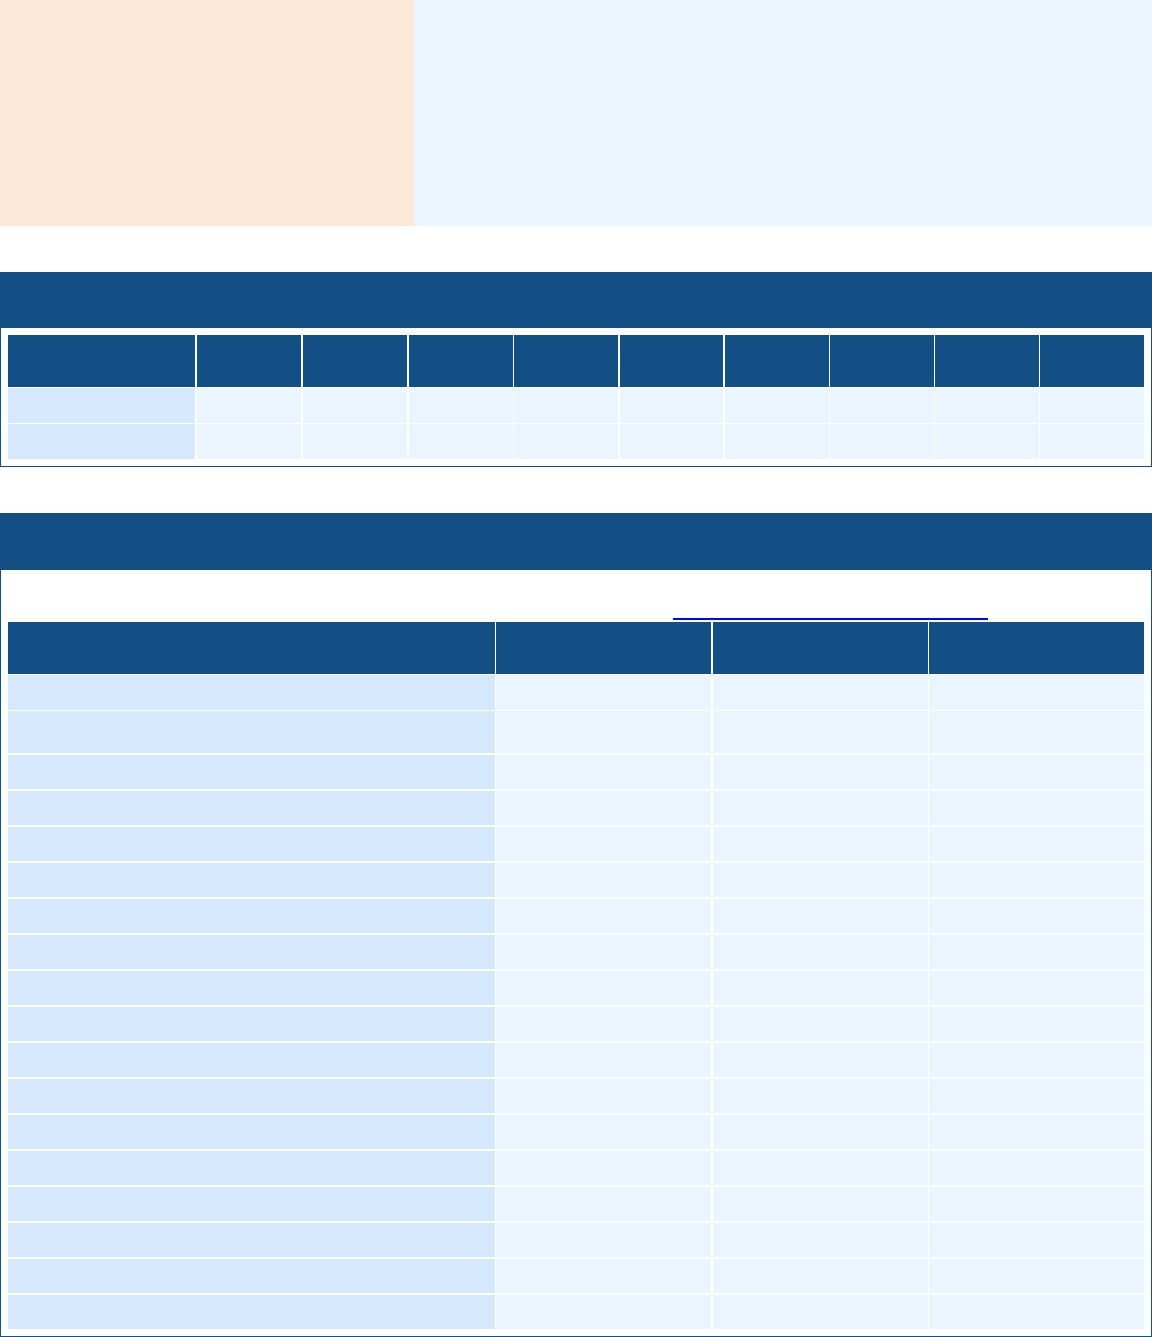
2020-21 Teacher Preparation and Placement
2020-21 Teacher Preparation and Placement
Authorization/Assignment
School
Number
School
Percent
District
Number
District
Percent
State
Number
State
Percent
Fully (Preliminary or Clear) Credentialed
for Subject and Student Placement
(properly assigned)
54.30
89.38
254.90
89.74
228366.10
83.12
Intern Credential Holders Properly
Assigned
0.00
0.00
3.70
1.32
4205.90
1.53
Teachers Without Credentials and
Misassignments (“ineffective” under
ESSA)
2.50
4.11
11.70
4.14
11216.70
4.08
Credentialed Teachers Assigned Out-of-
Field (“out-of-field” under ESSA)
3.90
6.50
11.40
4.03
12115.80
4.41
Unknown
0.00
0.00
2.10
0.76
18854.30
6.86
Total Teaching Positions
60.80
100.00
284.10
100.00
274759.10
100.00
Note: The data in this table is based on Full Time Equivalent (FTE) status. One FTE equals one staff member working full time;
one FTE could also represent two staff members who each work 50 percent of full time. Additionally, an assignment is defined as
a position that an educator is assigned based on setting, subject, and grade level. An authorization is defined as the services that
an educator is authorized to provide to students.
2021-22 Teacher Preparation and Placement
2021-22 Teacher Preparation and Placement
Authorization/Assignment
School
Number
School
Percent
District
Number
District
Percent
State
Number
State
Percent
Fully (Preliminary or Clear) Credentialed
for Subject and Student Placement
(properly assigned)
60.70
95.68
269.60
91.30
234405.20
84.00
Intern Credential Holders Properly
Assigned
0.00
0.00
4.60
1.57
4853.00
1.74
Teachers Without Credentials and
Misassignments (“ineffective” under
ESSA)
0.40
0.63
7.30
2.50
12001.50
4.30
Credentialed Teachers Assigned Out-of-
Field (“out-of-field” under ESSA)
1.60
2.63
9.20
3.12
11953.10
4.28
Unknown
0.60
1.04
4.40
1.51
15831.90
5.67
Total Teaching Positions
63.40
100.00
295.30
100.00
279044.80
100.00
The CDE published the first year of available teacher data for the 2020-21 SARC in June 2022, and the CDE published the
second year of data for the 2021-22 SARC in June 2023. The EC Section 33126(b)(5) requires the most recent three years of
teacher data to be requested in the SARC, as data is available. The teacher data for the 2022-23 SARC will not be available
prior to February 1, 2024, and therefore is not included in the template.
Note: The data in this table is based on Full-Time Equivalent (FTE) status. One FTE equals one staff member working full time;
one FTE could also represent two staff members who each work 50 percent of full time. Additionally, an assignment is defined as
a position that an educator is assigned based on setting, subject, and grade level. An authorization is defined as the services that
an educator is authorized to provide to students.
2023 School Accountability Report Card Page 6 of 23 Miramonte High School
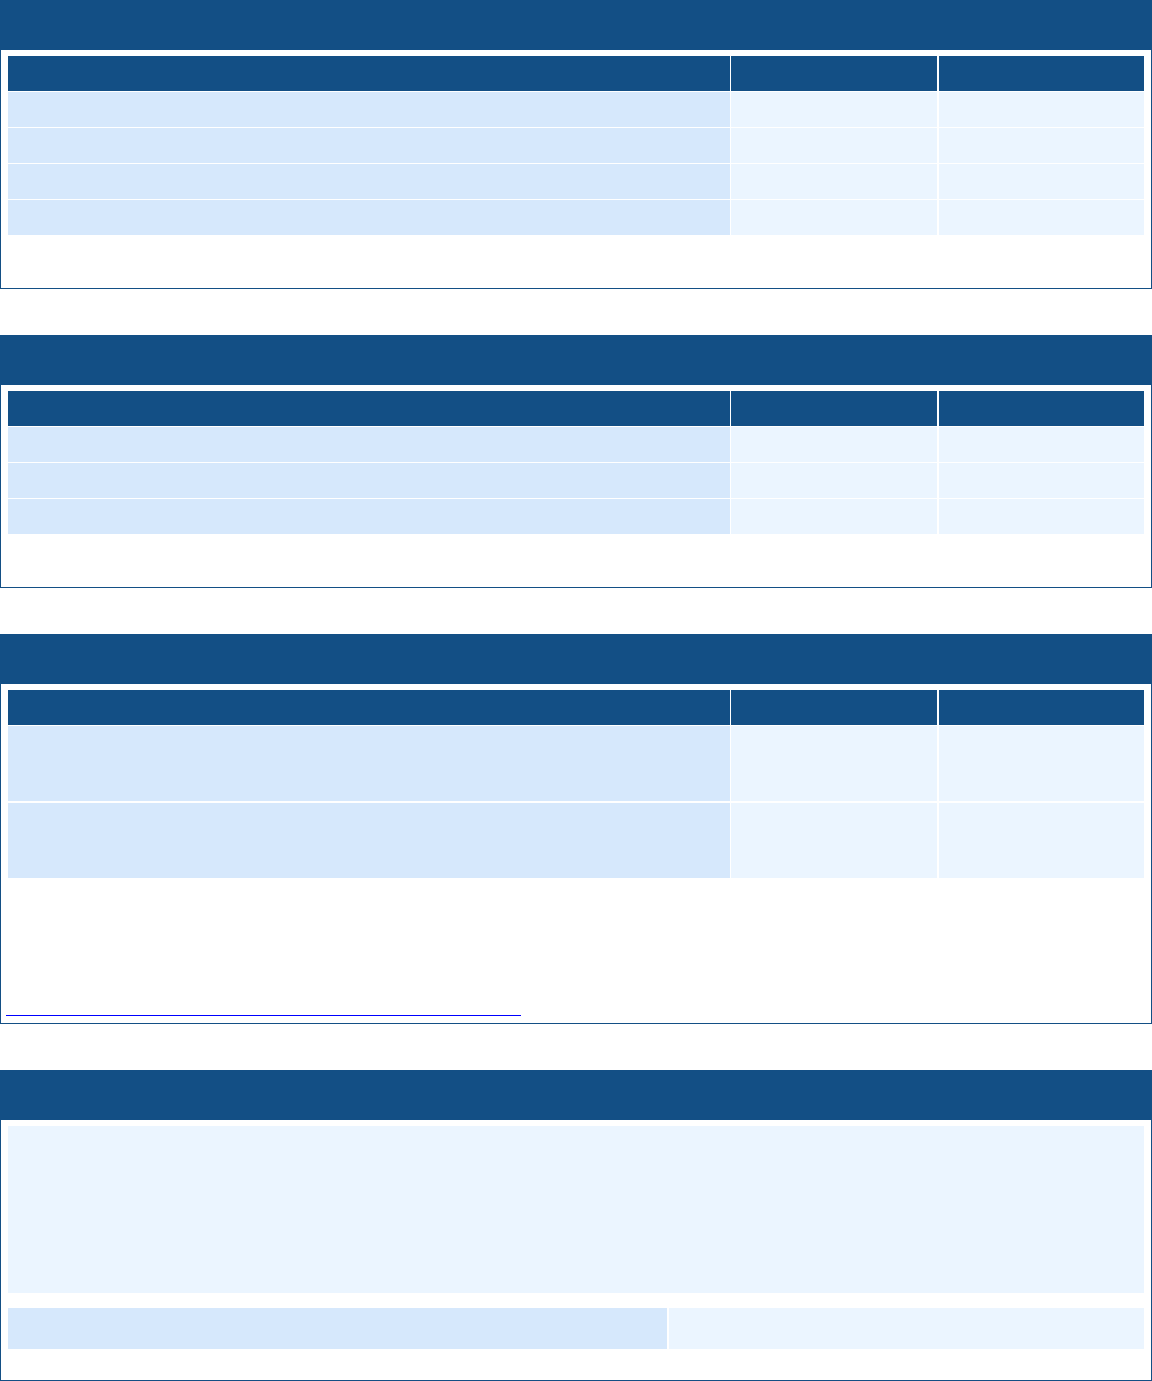
Teachers Without Credentials and Misassignments (considered “ineffective” under ESSA)
Teachers Without Credentials and Misassignments (considered “ineffective” under ESSA)
Authorization/Assignment
2020-21
2021-22
Permits and Waivers
0.00
0.00
Misassignments
2.50
0.40
Vacant Positions
0.00
0.00
Total Teachers Without Credentials and Misassignments
2.50
0.40
The teacher data for the 2022-23 SARC will not be available prior to February 1, 2024, and therefore is not included in the template.
Credentialed Teachers Assigned Out-of-Field (considered “out-of-field” under ESSA)
Credentialed Teachers Assigned Out-of-Field (considered “out-of-field” under ESSA)
Indicator
2020-21
2021-22
Credentialed Teachers Authorized on a Permit or Waiver
1.20
0.00
Local Assignment Options
2.60
1.60
Total Out-of-Field Teachers
3.90
1.60
The teacher data for the 2022-23 SARC will not be available prior to February 1, 2024, and therefore is not included in the template.
Class Assignments
Class Assignments
Indicator
2020-21
2021-22
Misassignments for English Learners
(a percentage of all the classes with English learners taught by teachers that are
misassigned)
6.3
3.5
No credential, permit or authorization to teach
(a percentage of all the classes taught by teachers with no record of an
authorization to teach)
0
0
The teacher data for the 2022-23 SARC will not be available prior to February 1, 2024, and therefore is not included in the
template.
Note: For more information refer to the Updated Teacher Equity Definitions web page at
https://www.cde.ca.gov/pd/ee/teacherequitydefinitions.asp.
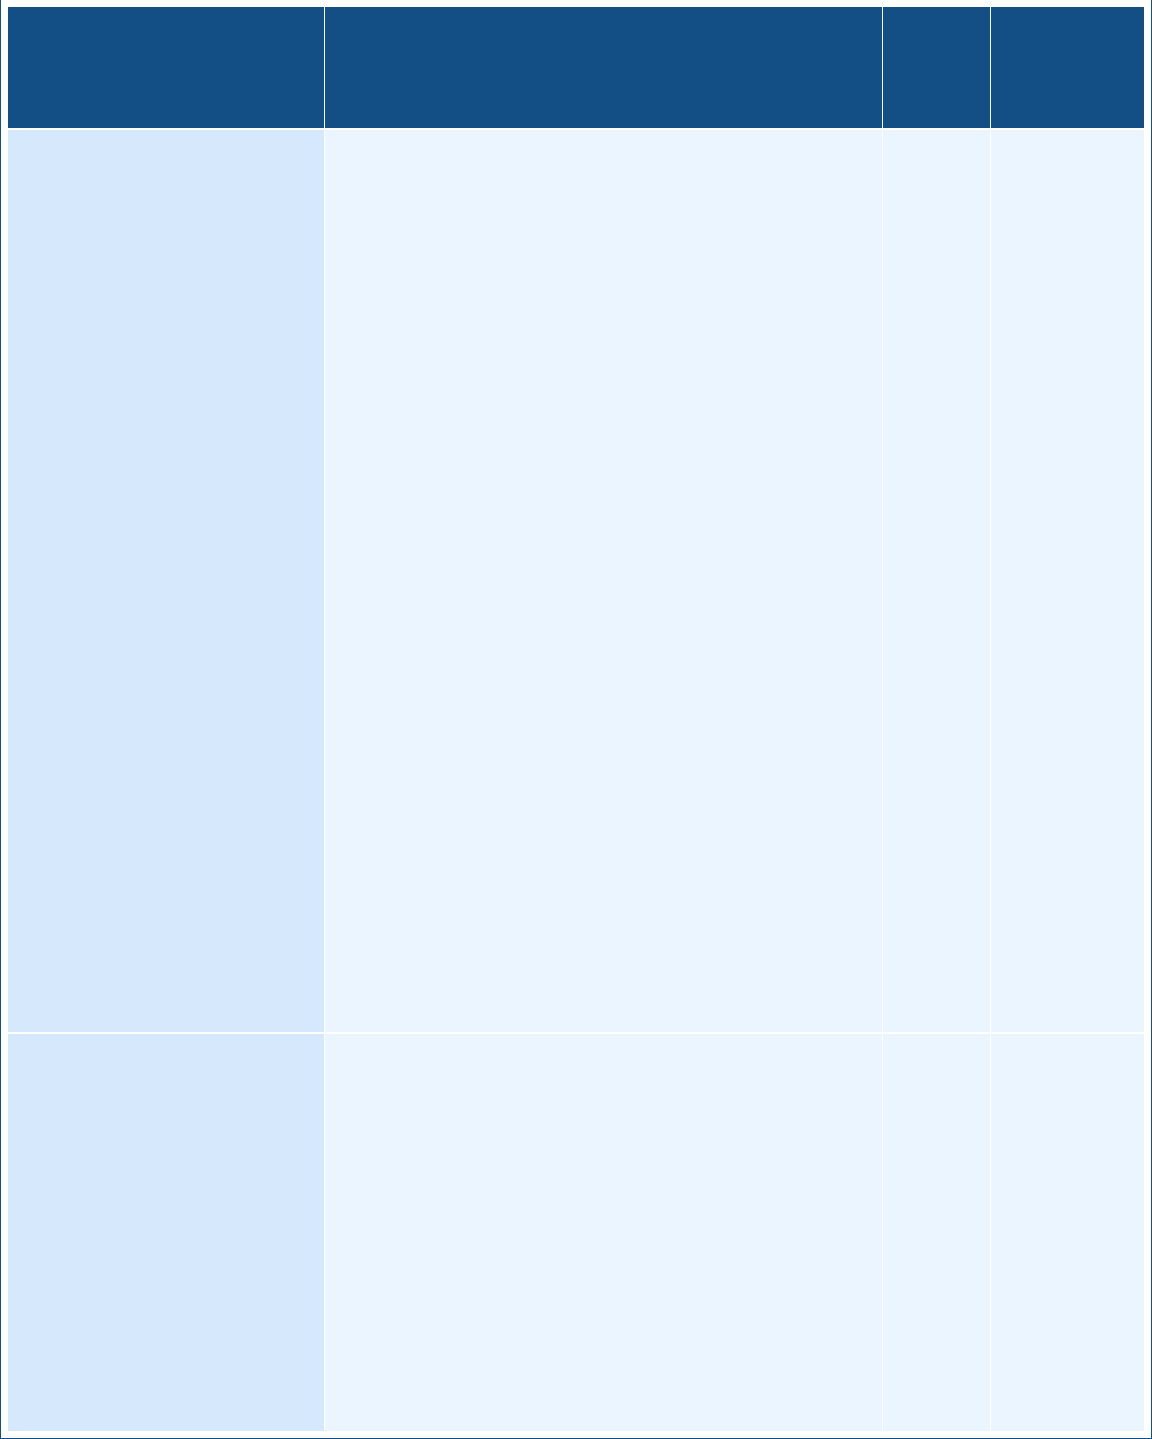
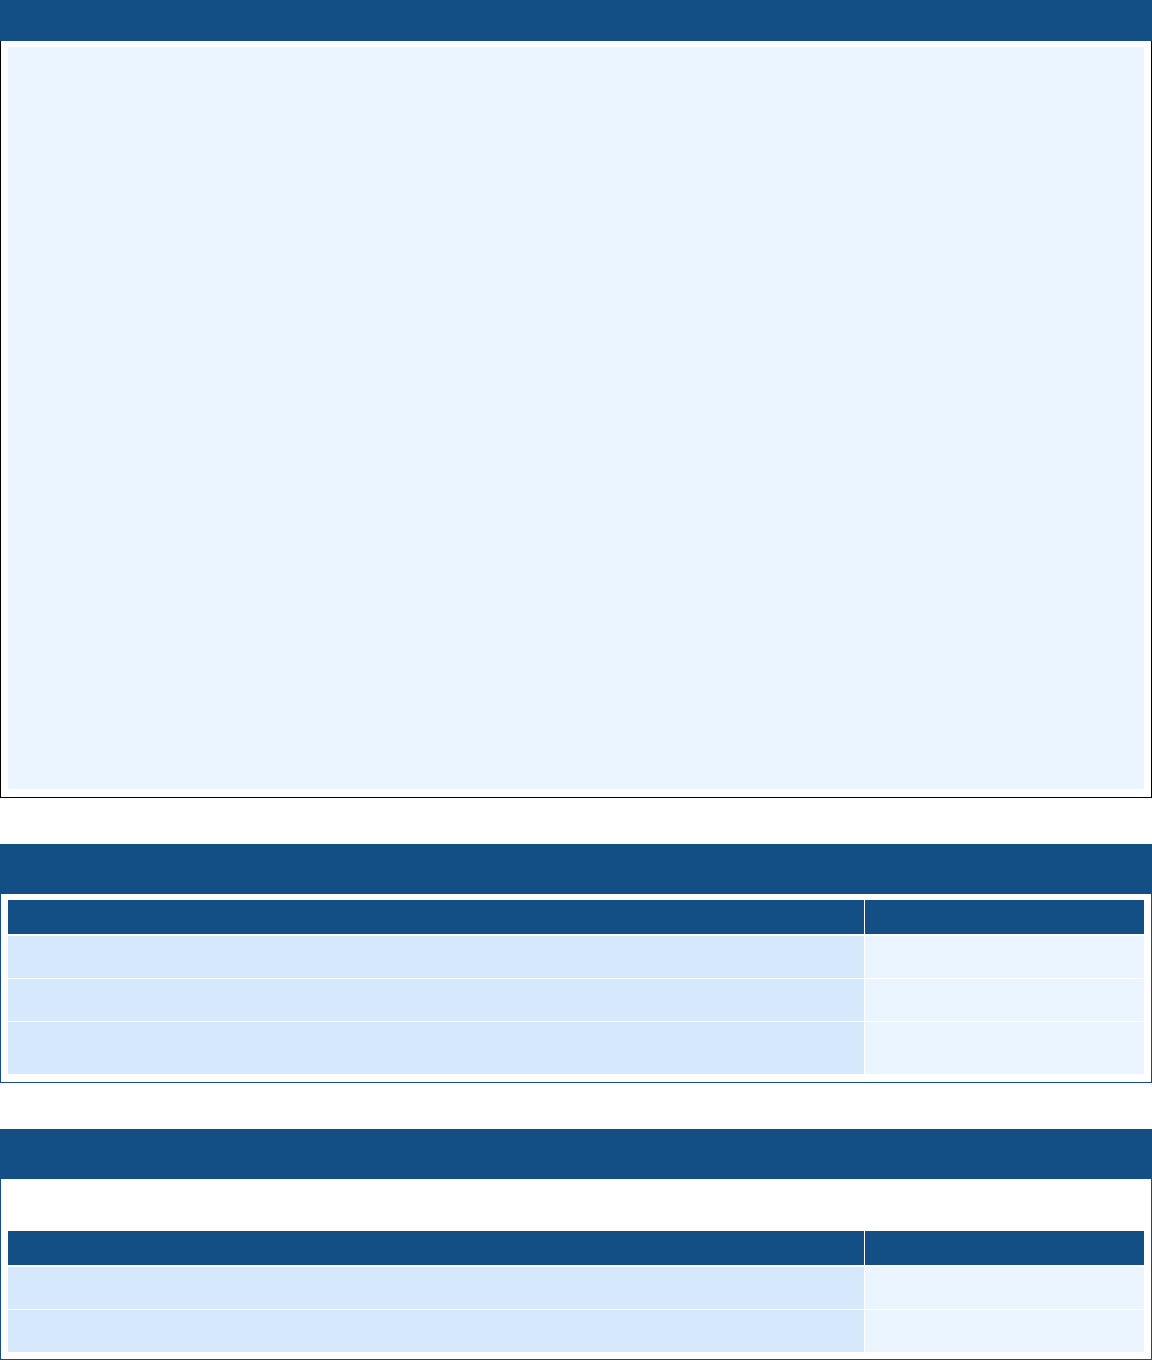
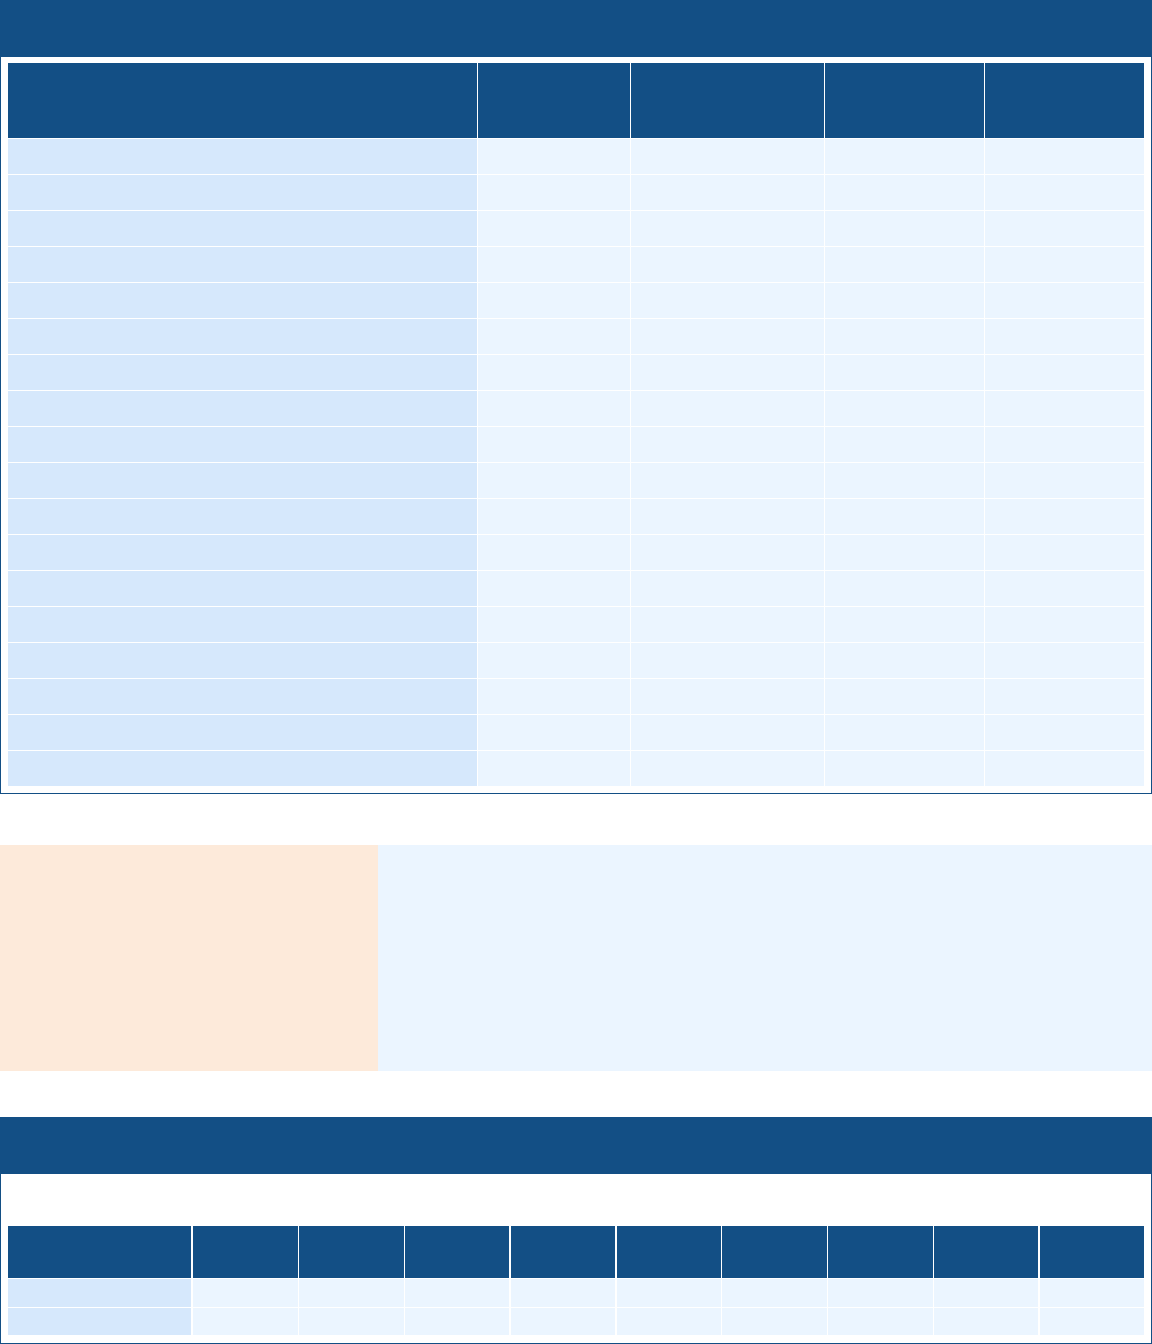
2023-24 Quality, Currency, Availability of Textbooks and Other Instructional Materials
2023-24 Quality, Currency, Availability of Textbooks and Other Instructional Materials
Textbooks used by Acalanes UHSD are based on current California content standards. Textbooks are chosen from lists pre-
approved by state education officials.
In accordance with the California Education Code and the Williams Settlement mandates, procedures, monitoring processes,
and reporting practices by principals and District departments have ensured that all students have access to the current,
Standards-based textbooks, and instructional materials.
Year and month in which the data were collected
09/2023
2023 School Accountability Report Card Page 7 of 23 Miramonte High School
Subject
Textbooks and Other Instructional Materials/year of
Adoption
From
Most
Recent
Adoption
?
Percent
Students
Lacking Own
Assigned
Copy
Reading/Language Arts
Edge
Adopted 2007
High Point (Level 1)
Adopted 2007
Impact, 50 Short Stories; 2nd Edition
Adopted 2003
Poetry, A Pocket Anthology
Adopted 2003
Poets
Adopted 2003
Points of View: An Anthology of Short Stories
Adopted 2003
Short Prose Reader; 3rd Edi??on
Adopted 2003
Talking Back/Poems, A Working Guide/Aspiring Poets
Adopted 2003
The Compact Reader; 7th Edi??on
Adopted 2003
The Word Within the Word, Vol. 1
Adopted 2003
The Word Within the Word, Vol. 1 (Eng 2)
Adopted 2003
The Word Within the Word, Vol. 1 (Eng 3)
Adopted 2003
The Word Within the Word, Vol. 1 (Eng 4)
Adopted 2003
Yes
0.0%
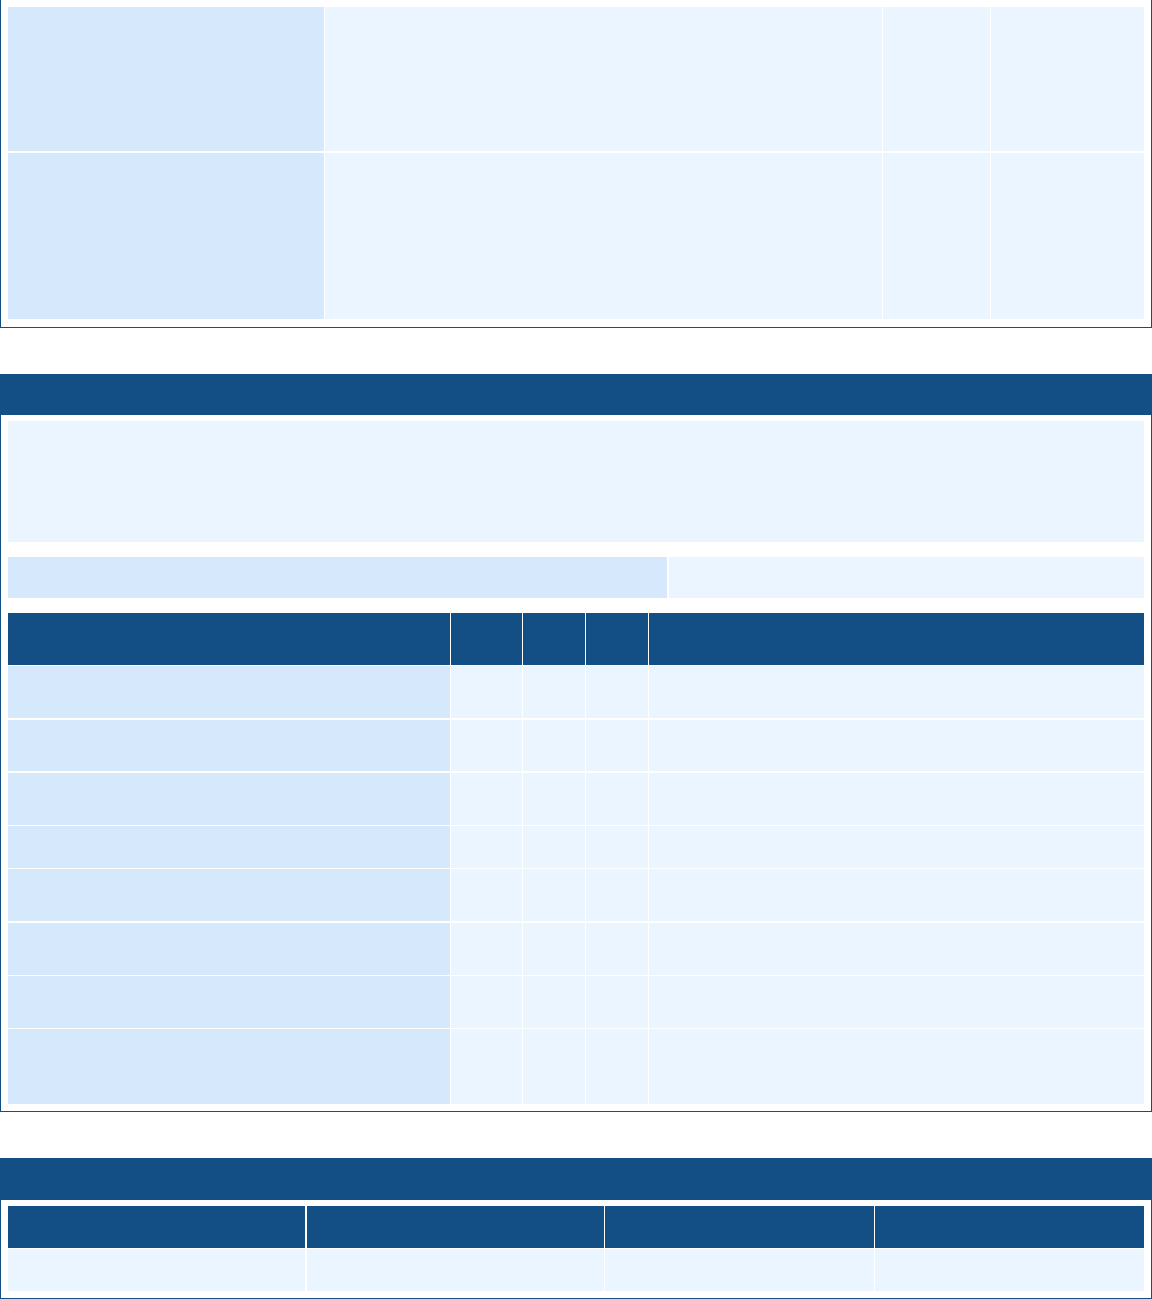
Mathematics
Algebra & Trigonometry
Adopted 2002
Algebra 1 Big Ideas
Adopted 2015
Algebra and Trigonometry, 5th Ed.
Adopted 2002
Algebra II: Concepts, Skills and Problem Solving, CA
Edi??on
Adopted 2008
Calculus I, 8th Ed.
Adopted
2006
Yes
0.0%

2023 School Accountability Report Card Page 8 of 23 Miramonte High School
Calculus II, 8th Ed.
Adopted 2006
California Algebra Readiness
Adopted 2007
California Geometry
Adopted 2007
Concepts, Skills, and Problem Solving
Adopted 2008
Geometry Big Ideas
Adopted 2016
Multivariable Calculus, 8th Ed. (Supplemental)
Adopted 2006
Precalculus Mathematics for Calculus
Adopted 2018
Pre-Calculus Common Core
Adopted 2018
The Practice of Statistics
Adopted 2003
Science
Biology, 7th ed.
Adopted 2004
Biology: Exploring Life
Adopted 2006
Biotechnology: Demystifying the Concept
Adopted 2000
Chemistry, 7th Ed.
Adopted 2007
Chemistry AP Edition
Adopted 2006
Earth Science; Geology, the Environ., and the Universe
Adopted 2002
Essentials of Human Anatomy and Physiology, 8th ed.
Adopted 2006
Human Anatomy and Physiology, 6th ed.
Adopted 2005
Living in The Environment, 14th ed.
Adopted 2004
Oceanography; An Invitation to Marine Science, 4th Ed
Adopted 2003
Physics
Adopted 2004
Yes
0.0%

2023 School Accountability Report Card Page 9 of 23 Miramonte High School
Physics: Principles with Applications, 4th Ed. AP (Physics
AP)
Adopted 2005
World of Chemistry
Adopted 2008
History-Social Science
A People & A Nation, 7th Ed.
Adopted 2004
Cultural Landscape: An Intro. to Human Geography
Adopted 2006
Human Geography in Action, 4th ed. (Supplemental)
Adopted 2006
Impact CA Social Studies - World History, Culture &
Geography
Adopted 2018
Psychology, 11th ed.
Adopted 2017
Myers' Psychology for AP
Adopted 2017
United States Government: Democracy in Action
Adopted 2010
California - United States History, The 20th Century
Adopted 2018
Economics Concepts and Choices, California Ed.
Adopted 2008
History of Western Society Since 1300 AP European
Adopted 2005
Introduction to Comparative Politics
Adopted 2012
Yes
0.0%
Foreign Language
Bon Voyage, Levels 1-3
Adopted 2003-04
El Espanol para Nosotros, Books 1 & 2
Adopted 2005
Latin for Americans, Level 1
Adopted 2003
Latin for Americans, Book 1 (Latin 2); Book 2 (Latin 2 & Latin
3)
Adopted 2003
NiHao 1, Chinese Language Course, Introductory, Level III &
IV
Adopted 2004
Senderos, Levels 1-2
Adopted 2017
Yes
0.0%
2023 School Accountability Report Card Page 10 of 23 Miramonte High School
Avancemos! 3
Adopted 2017
Imagina
Adopted 2014
Health
Health & Wellness
Adopted 2005
Kinetic Energy
Adopted 2006
Yes
0.0%
School Facility Conditions and Planned Improvements
School Facility Conditions and Planned Improvements
Miramonte High School was constructed in 1954. Since then, several modernization projects have been completed, with the
most recent in 2010. Miramonte High School provides a safe and clean environment that effectively caters to the needs of its
students. The school buildings and grounds are in fair condition, considering their age. The library roof was replaced in 2019,
and the roofs of the 430 and 440 buildings were also replaced in 2023. In addition, the stadium field underwent turf and track
renovations. Modernization projects are scheduled to occur between 2024 and 2025.
Year and month of the most recent FIT report
12/6/23
System Inspected
Rate
Good
Rate
Fair
Rate
Poor
Repair Needed and Action Taken or Planned
Systems:
Gas Leaks, Mechanical/HVAC, Sewer
X
Interior:
Interior Surfaces
X
Roofing support beams have cracks throughout
campus.
Cleanliness:
Overall Cleanliness, Pest/Vermin Infestation
X
Electrical
X
Restrooms/Fountains:
Restrooms, Sinks/ Fountains
X
Safety:
Fire Safety, Hazardous Materials
X
Structural:
Structural Damage, Roofs
X
External:
Playground/School Grounds, Windows/
Doors/Gates/Fences
X
Overall Facility Rate
Overall Facility Rate
Exemplary
Good
Fair
Poor
X
B. Pupil Outcomes (State Priority: Pupil Achievement)
2023 School Accountability Report Card Page 11 of 23 Miramonte High School
B. Pupil Outcomes
State Priority: Pupil Achievement
The SARC provides the following information relevant to the State priority: Pupil Achievement
(Priority 4):
Statewide Assessments
(i.e., California Assessment of Student Performance and Progress [CAASPP] System
includes the Smarter Balanced Summative Assessments for students in the general
education population and the California Alternate Assessments [CAAs] for English language
arts/literacy [ELA] and mathematics given in grades three through eight and grade eleven.
Only eligible students may participate in the administration of the CAAs. CAAs items are
aligned with alternate achievement standards, which are linked with the Common Core State
Standards [CCSS] for students with the most significant cognitive disabilities).
The CAASPP System encompasses the following assessments and student participation
requirements:
1. Smarter Balanced Summative Assessments and CAAs for ELA in grades three
through eight and grade eleven.
2. Smarter Balanced Summative Assessments and CAAs for mathematics in grades
three through eight and grade eleven.
3. California Science Test (CAST) and CAAs for Science in grades five, eight, and once
in high school (i.e., grade ten, eleven, or twelve).
College and Career Ready
The percentage of students who have successfully completed courses that satisfy the
requirements for entrance to the University of California and the California State University,
or career technical education sequences or programs of study.
Percentage of Students Meeting or Exceeding the State Standard on CAASPP
Percentage of Students Meeting or Exceeding the State Standard on CAASPP
This table displays CAASPP test results in ELA and mathematics for all students grades three through eight and grade eleven
taking and completing a state-administered assessment.
Percentages are not calculated when the number of students tested is ten or less, either because the number of students in this
category is too small for statistical accuracy or to protect student privacy.
ELA and mathematics test results include the Smarter Balanced Summative Assessment and the CAA. The “Percent Met or
Exceeded” is calculated by taking the total number of students who met or exceeded the standard on the Smarter Balanced
Summative Assessment plus the total number of students who met the standard (i.e., achieved Level 3-Alternate) on the CAAs
divided by the total number of students who participated in both assessments.
Subject
School
2021-22
School
2022-23
District
2021-22
District
2022-23
State
2021-22
State
2022-23
English Language Arts/Literacy
(grades 3-8 and 11)
80
84
78
82
47
46
Mathematics
(grades 3-8 and 11)
72
70
65
65
33
34
2023 School Accountability Report Card Page 12 of 23 Miramonte High School
2022-23 CAASPP Test Results in ELA by Student Group
2022-23 CAASPP Test Results in ELA by Student Group
This table displays CAASPP test results in ELA by student group for students grades three through eight and grade eleven taking
and completing a state-administered assessment.
ELA test results include the Smarter Balanced Summative Assessment and the CAA. The “Percent Met or Exceeded” is calculated
by taking the total number of students who met or exceeded the standard on the Smarter Balanced Summative Assessment plus
the total number of students who met the standard (i.e., achieved Level 3-Alternate) on the CAAs divided by the total number of
students who participated in both assessments.
Double dashes (--) appear in the table when the number of students is ten or less, either because the number of students in this
category is too small for statistical accuracy or to protect student privacy.
The number of students tested includes all students who participated in the test whether they received a score or not; however,
the number of students tested is not the number that was used to calculate the achievement level percentages. The achievement
level percentages are calculated using only students who received scores.
CAASPP
Student Groups
CAASPP
Total
Enrollment
CAASPP
Number
Tested
CAASPP
Percent
Tested
CAASPP
Percent
Not Tested
CAASPP
Percent
Met or
Exceeded
All Students
289
283
97.92
2.08
84.45
Female
126
123
97.62
2.38
86.99
Male
161
158
98.14
1.86
82.28
American Indian or Alaska Native
--
--
--
--
--
Asian
69
69
100.00
0.00
91.30
Black or African American
--
--
--
--
--
Filipino
--
--
--
--
--
Hispanic or Latino
24
24
100.00
0.00
70.83
Native Hawaiian or Pacific Islander
0
0
0
0
0
Two or More Races
11
11
100.00
0.00
72.73
White
180
174
96.67
3.33
83.91
English Learners
--
--
--
--
--
Foster Youth
0
0
0
0
0
Homeless
0
0
0
0
0
Military
--
--
--
--
--
Socioeconomically Disadvantaged
18
18
100.00
0.00
66.67
Students Receiving Migrant Education Services
0
0
0
0
0
Students with Disabilities
29
26
89.66
10.34
42.31

2023 School Accountability Report Card Page 13 of 23 Miramonte High School
2022-23 CAASPP Test Results in Math by Student Group
2022-23 CAASPP Test Results in Math by Student Group
This table displays CAASPP test results in Math by student group for students grades three through eight and grade eleven taking
and completing a state-administered assessment.
Mathematics test results include the Smarter Balanced Summative Assessment and the CAA. The “Percent Met or Exceeded” is
calculated by taking the total number of students who met or exceeded the standard on the Smarter Balanced Summative
Assessment plus the total number of students who met the standard (i.e., achieved Level 3-Alternate) on the CAAs divided by the
total number of students who participated in both assessments.
Double dashes (--) appear in the table when the number of students is ten or less, either because the number of students in this
category is too small for statistical accuracy or to protect student privacy.
The number of students tested includes all students who participated in the test whether they received a score or not; however,
the number of students tested is not the number that was used to calculate the achievement level percentages. The achievement
level percentages are calculated using only students who received scores.
CAASPP
Student Groups
CAASPP
Total
Enrollment
CAASPP
Number
Tested
CAASPP
Percent
Tested
CAASPP
Percent
Not Tested
CAASPP
Percent
Met or
Exceeded
All Students
289
284
98.27
1.73
69.72
Female
126
123
97.62
2.38
61.79
Male
161
159
98.76
1.24
75.47
American Indian or Alaska Native
--
--
--
--
--
Asian
69
69
100.00
0.00
86.96
Black or African American
--
--
--
--
--
Filipino
--
--
--
--
--
Hispanic or Latino
24
24
100.00
0.00
66.67
Native Hawaiian or Pacific Islander
0
0
0
0
0
Two or More Races
11
11
100.00
0.00
45.45
White
180
175
97.22
2.78
64.57
English Learners
--
--
--
--
--
Foster Youth
0
0
0
0
0
Homeless
0
0
0
0
0
Military
--
--
--
--
--
Socioeconomically Disadvantaged
18
18
100.00
0.00
55.56
Students Receiving Migrant Education Services
0
0
0
0
0
Students with Disabilities
29
26
89.66
10.34
26.92
2023 School Accountability Report Card Page 14 of 23 Miramonte High School
CAASPP Test Results in Science for All Students
CAASPP Test Results in Science for All Students
This table displays the percentage of all students grades five, eight, and High School meeting or exceeding the State Standard.
Science test results include the CAST and the CAA. The “Percent Met or Exceeded” is calculated by taking the total number of
students who met or exceeded the standard on the CAST plus the total number of students who met the standard (i.e., achieved
Level 3-Alternate) on the CAAs divided by the total number of students who participated in both assessments.
The number of students tested includes all students who participated in the test whether they received a score or not; however,
the number of students tested is not the number that was used to calculate the achievement level percentages. The achievement
level percentages are calculated using only students who received scores.
Subject
School
2021-22
School
2022-23
District
2021-22
District
2022-23
State
2021-22
State
2022-23
Science
(grades 5, 8 and high school)
61.19
68.43
60.01
64.23
29.47
30.29
2022-23 CAASPP Test Results in Science by Student Group
2022-23 CAASPP Test Results in Science by Student Group
This table displays CAASPP test results in Science by student group for students grades five, eight, and High School. Double
dashes (--) appear in the table when the number of students is ten or less, either because the number of students in this category
is too small for statistical accuracy or to protect student privacy.
Student Group
Total
Enrollment
Number
Tested
Percent
Tested
Percent
Not Tested
Percent
Met or
Exceeded
All Students
567
552
97.35
2.65
68.30
Female
264
257
97.35
2.65
70.82
Male
299
292
97.66
2.34
65.75
American Indian or Alaska Native
--
--
--
--
--
Asian
124
121
97.58
2.42
75.21
Black or African American
--
--
--
--
--
Filipino
--
--
--
--
--
Hispanic or Latino
42
41
97.62
2.38
56.10
Native Hawaiian or Pacific Islander
--
--
--
--
--
Two or More Races
30
29
96.67
3.33
62.07
White
350
341
97.43
2.57
68.62
English Learners
--
--
--
--
--
Foster Youth
--
--
--
--
--
Homeless
--
--
--
--
--
Military
--
--
--
--
--
Socioeconomically Disadvantaged
30
30
100.00
0.00
43.33
Students Receiving Migrant Education Services
0
0
0
0
0
Students with Disabilities
56
46
82.14
17.86
21.74
2023 School Accountability Report Card Page 15 of 23 Miramonte High School
2022-23 Career Technical Education Programs
2022-23 Career Technical Education Programs
Miramonte High School offers a diverse array of Career Technical Education (CTE) courses designed to help students prepare
for college and career opportunities. CTE programs receive funding from the Acalanes Union High School District and the
Contra Costa County Office of Education through the Regional Occupation Program (ROP). Funding for ROP comes from
State of California CTE grants. All CTE courses are academically focused and provide students with training essential for
college and career opportunities. District-approved courses of study provide a framework for the courses, and the courses align
with California’s model curriculum standards for CTE. The core leaders for CTE in the Acalanes Union High School District are
Ryan Shelly, Acalanes High School (Transportation); Steve Boone, Campolindo High School (Engineering and Architecture
and Transportation); Jill McTaggart, Las Lomas High School (Hospitality, Tourism and Recreation); and John Grigsby,
Miramonte High School (Health Science and Medical Technology). AUHSD and ROP staff regularly evaluate the CTE courses.
Through the County ROP advisory committee, CTE teachers receive input and guidance from leaders in a variety of industry
sectors.
Miramonte High School offers CTE courses to all students:
Intro to Computer Science
AP Computer Science A
AP Computer Science Principles
Digital Design 1 (Sequence)
*Digital Design 2 (Sequence)
*Digital Electronics (Sequence)
AP Environmental Science
Foods 1 (Sequence)
Foods Advanced International Cuisine (Sequence)
AP Music Theory
*Photography/Digital Design
Principles of Engineering
*Sports Medicine (Sequence)
*Sports Medicine Advanced (Sequence)
Stagecraft
*Designated ROP funding
--------
2022-23 Career Technical Education (CTE) Participation
2022-23 Career Technical Education (CTE) Participation
Measure
CTE Program Participation
Number of Pupils Participating in CTE
194
Percent of Pupils that Complete a CTE Program and Earn a High School Diploma
37.5
Percent of CTE Courses that are Sequenced or Articulated Between the School and
Institutions of Postsecondary Education
Course Enrollment/Completion
Course Enrollment/Completion
This table displays the course enrollment/completion of University of California (UC) and/or California State University (CSU)
admission requirements.
UC/CSU Course Measure
Percent
2022-23 Pupils Enrolled in Courses Required for UC/CSU Admission
100
2021-22 Graduates Who Completed All Courses Required for UC/CSU Admission
81.23
2023 School Accountability Report Card Page 16 of 23 Miramonte High School
B. Pupil Outcomes
State Priority: Other Pupil Outcomes
The SARC provides the following information relevant to the State priority: Other Pupil
Outcomes (Priority 8): Pupil outcomes in the subject area of physical education.
B. Pupil Outcomes (State Priority: Other Pupil Outcomes)
2022-23 California Physical Fitness Test Results
2022-23 California Physical Fitness Test Results
This table displays the percentage of students participating in each of the five fitness components of the California Physical Fitness
Test Results. The administration of the PFT during 2021-22 and 2022-23 school years, only participation results are required for
these five fitness areas. Percentages are not calculated and double dashes (--) appear in the table when the number of students
tested is ten or less, either because the number of students in this category is too small for statistical accuracy or to protect student
privacy.
Grade Level
Component 1:
Aerobic Capacity
Component 2:
Abdominal
Strength and
Endurance
Component 3:
Trunk Extensor
and Strength and
Flexibility
Component 4:
Upper Body
Strength and
Endurance
Component 5:
Flexibility
Grade 9
98
98
98
98
98
C. Engagement (State Priority: Parental Involvement)
C. Engagement
State Priority: Parental Involvement
The SARC provides the following information relevant to the State priority: Parental
Involvement (Priority 3): Efforts the school district makes to seek parent input in making
decisions regarding the school district and at each school site.
2023-24 Opportunities for Parental Involvement
2023-24 Opportunities for Parental Involvement
Three parent volunteer organizations work together to enhance the high school experience for students at Miramonte. These
three parent organizations conduct fundraising activities and recruit parent volunteers to support many student programs and
activities that otherwise would not be available at a public high school.
Miramonte High School Parents’ Club (MHSPC)
The Parents’ Club fosters academic excellence by raising funds and providing volunteers to support and enrich the educational
experience for all students at Miramonte High School. The MHSPC includes an additional parent body, the Equity, Diversity,
and Inclusion Group, that is focused specifically on implementing programming and education on the topic of equity.
Boosters Club
Members of the Boosters Club have a passion for sports and provide funds to help maintain Miramonte High School's excellent
sports programs.
ONE
The Orinda Network for Education (ONE) was created in the spring of 2020 uniting the Parents’ Clubs of all Orinda schools
(Del Rey, Glorietta, Miramonte, OIS, Sleepy Hollow and Wagner Ranch) with the community-based Educational Foundation of
Orinda (EFO) to establish a new fundraising foundation. ONE will strengthen, streamline and amplify collective fundraising
efforts to sustain the signature programs and instrumental staff that make Orinda schools exceptional. It will also ensure equity
and consistency across schools, and build a legacy for future students.
In addition to these organizations, the Miramonte Site Advisory Council monitors the achievement of school-wide goals. The
council is composed of administrators, staff, students, and parents. Throughout the year, a range of parent education events
are offered to provide additional support to families and ensure open and transparent dialogue. The Challenge Success Team,
focused on student and staff wellness and belonging, also includes parent volunteers.
For more information on how to become involved, please contact the Parent’s Club President at [email protected].
--------
2023 School Accountability Report Card Page 17 of 23 Miramonte High School
C. Engagement (State Priority: Pupil Engagement)
C. Engagement
State Priority: Pupil Engagement
The SARC provides the following information relevant to the State priority: Pupil
Engagement (Priority 5):
• High school dropout rates;
• High school graduation rates; and
• Chronic Absenteeism
Dropout Rate and Graduation Rate (Four-Year Cohort Rate)
Dropout Rate and Graduation Rate (Four-Year Cohort Rate)
Indicator
School
2020-21
School
2021-22
School
2022-23
District
2020-21
District
2021-22
District
2022-23
State
2020-21
State
2021-22
State
2022-23
Dropout Rate
0.3
1
0
1.1
0.8
1.3
9.4
7.8
8.2
Graduation Rate
98.6
98.1
97.9
97.7
97.5
96.7
83.6
87
86.2
2022-23 Graduation Rate by Student Group (Four-Year Cohort Rate)
2022-23 Graduation Rate by Student Group (Four-Year Cohort Rate)
This table displays the 2022-23 graduation rate by student group. For information on the Four-Year Adjusted Cohort Graduation
Rate (ACGR), visit the CDE Adjusted Cohort Graduation Rate web page at www.cde.ca.gov/ds/ad/acgrinfo.asp.
Student Group
Number of
Students in Cohort
Number of
Cohort Graduates
Cohort
Graduation Rate
All Students
280
274
97.9
Female
138
135
97.8
Male
140
137
97.9
Non-Binary
American Indian or Alaska Native
--
--
--
Asian
55
55
100.0
Black or African American
--
--
--
Filipino
--
--
--
Hispanic or Latino
19
17
89.5
Native Hawaiian or Pacific Islander
--
--
--
Two or More Races
13
13
100.0
White
171
167
97.7
English Learners
--
--
--
Foster Youth
--
--
--
Homeless
0.0
0.0
0.0
Socioeconomically Disadvantaged
16
15
93.8
Students Receiving Migrant Education Services
0.0
0.0
0.0
Students with Disabilities
43
39
90.7
2023 School Accountability Report Card Page 18 of 23 Miramonte High School
2022-23 Chronic Absenteeism by Student Group
2022-23 Chronic Absenteeism by Student Group
Student Group
Cumulative
Enrollment
Chronic
Absenteeism
Eligible Enrollment
Chronic
Absenteeism
Count
Chronic
Absenteeism
Rate
All Students
1177
1172
138
11.8
Female
564
560
68
12.1
Male
606
605
68
11.2
Non-Binary
7
7
2
28.6
American Indian or Alaska Native
4
4
1
25.0
Asian
263
262
14
5.3
Black or African American
15
15
1
6.7
Filipino
19
19
2
10.5
Hispanic or Latino
95
95
18
18.9
Native Hawaiian or Pacific Islander
2
2
1
50.0
Two or More Races
62
62
14
22.6
White
701
697
83
11.9
English Learners
9
9
1
11.1
Foster Youth
1
1
1
100.0
Homeless
1
1
0
0.0
Socioeconomically Disadvantaged
69
67
11
16.4
Students Receiving Migrant Education Services
0
0
0
0.0
Students with Disabilities
149
146
33
22.6
C. Engagement (State Priority: School Climate)
C. Engagement
State Priority: School Climate
The SARC provides the following information relevant to the State priority: School
Climate (Priority 6):
• Pupil suspension rates;
• Pupil expulsion rates; and
• Other local measures on the sense of safety
Suspensions and Expulsions
Suspensions and Expulsions
This table displays suspensions and expulsions data.
Rate
School
2020-21
School
2021-22
School
2022-23
District
2020-21
District
2021-22
District
2022-23
State
2020-21
State
2021-22
State
2022-23
Suspensions
0.25
1.33
1.10
0.12
1.59
1.33
0.20
3.17
3.60
Expulsions
0.00
0.00
0.00
0.00
0.00
0.02
0.00
0.07
0.08
2023 School Accountability Report Card Page 19 of 23 Miramonte High School
2022-23 Suspensions and Expulsions by Student Group
2022-23 Suspensions and Expulsions by Student Group
Student Group
Suspensions Rate
Expulsions Rate
All Students
1.1
0
Female
0.53
0
Male
1.65
0
Non-Binary
American Indian or Alaska Native
0
0
Asian
1.14
0
Black or African American
0
0
Filipino
0
0
Hispanic or Latino
3.16
0
Native Hawaiian or Pacific Islander
0
0
Two or More Races
0
0
White
1
0
English Learners
0
0
Foster Youth
0
0
Homeless
0
0
Socioeconomically Disadvantaged
1.45
0
Students Receiving Migrant Education Services
0
0
Students with Disabilities
3.36
0
2023-24 School Safety Plan
2023-24 School Safety Plan
Safety is a top priority at Miramonte High School. In addition to three administrators, Miramonte employs two campus
supervisors to provide security during school hours. While the administrators oversee campus safety, all staff members actively
participate in keeping the campus safe. Miramonte’s emergency plans are updated annually with fire, disaster, and lockdown
drills held each year. Students are informed of these drills and lessons are given in classrooms to ensure that students
understand protocols and are prepared to respond in the event of an emergency. Staff members engage in annual
professional development on safety procedures, emergency medical response, and identifying signs of student wellness.
Miramonte has opened a Wellness Center on campus to provide services to meet the social-emotional needs of students. The
Wellness Center is staffed by a Wellness Coordinator, an Intake Specialist, and counseling interns.
Miramonte is a closed campus and visitors are required to sign in at the main office and wear an identifying badge.
Miramonte participates in a district-wide safety plan in partnership with local agencies. The School Safety Plan was last
reviewed, updated, and discussed with the school faculty in August 2023. Expectations for school behavior are outlined in the
student handbook, which is reviewed with every student at the start of the year.
During COVID-19, Miramonte High School has adopted all State and County regulations and stays up-to-date with appropriate
safety protocols recommended by these institutions and the CDC.
--------
2023 School Accountability Report Card Page 20 of 23 Miramonte High School
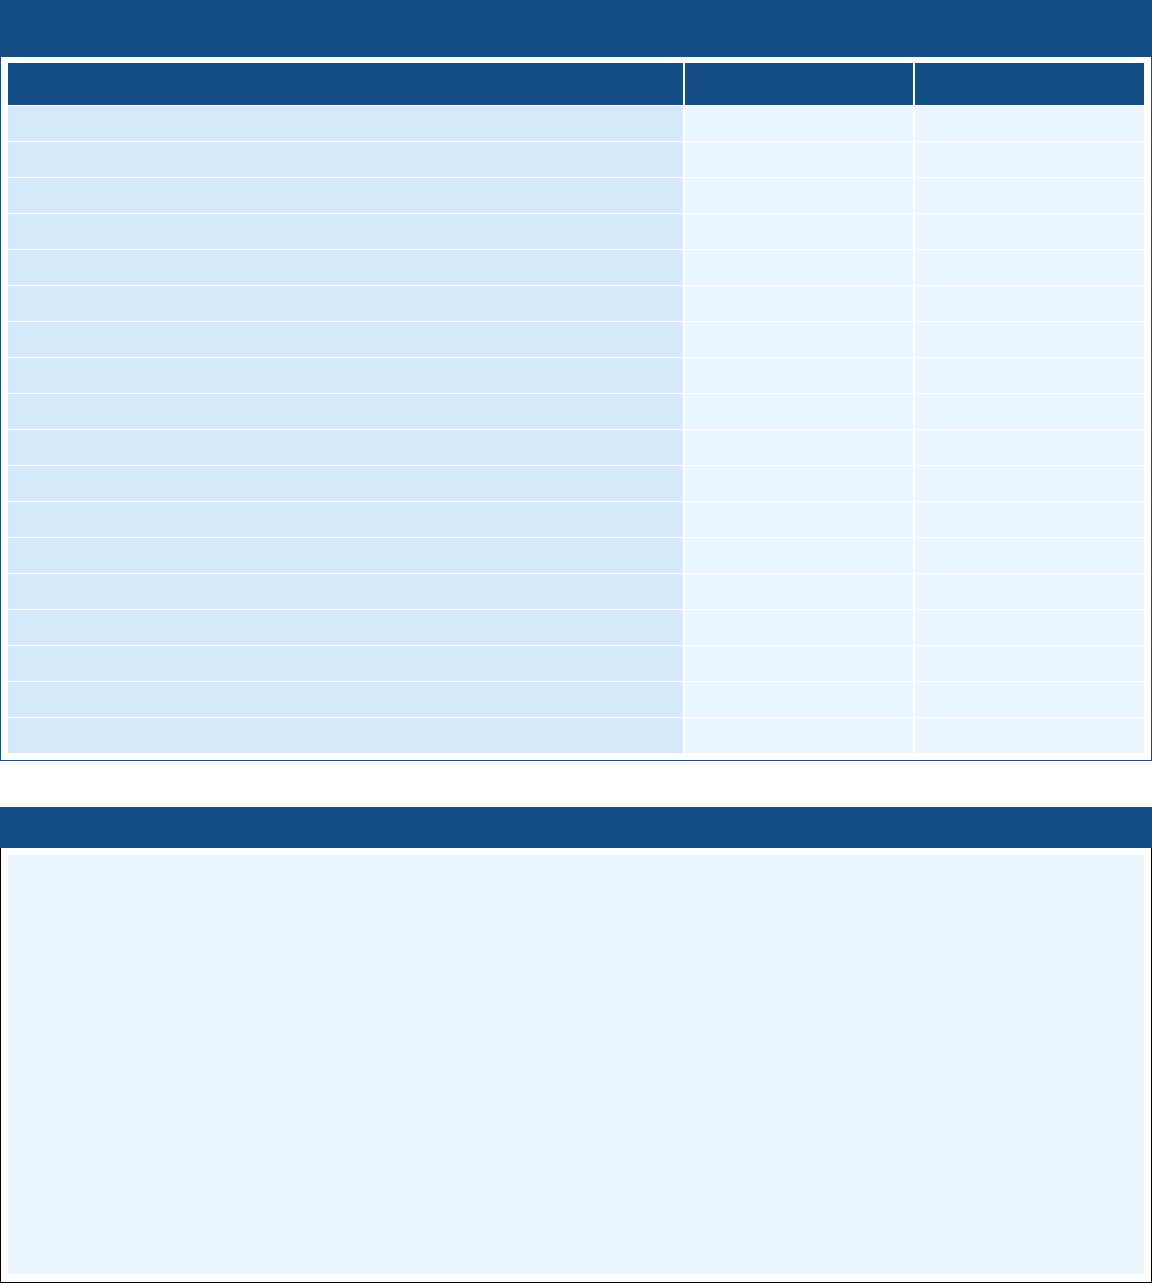
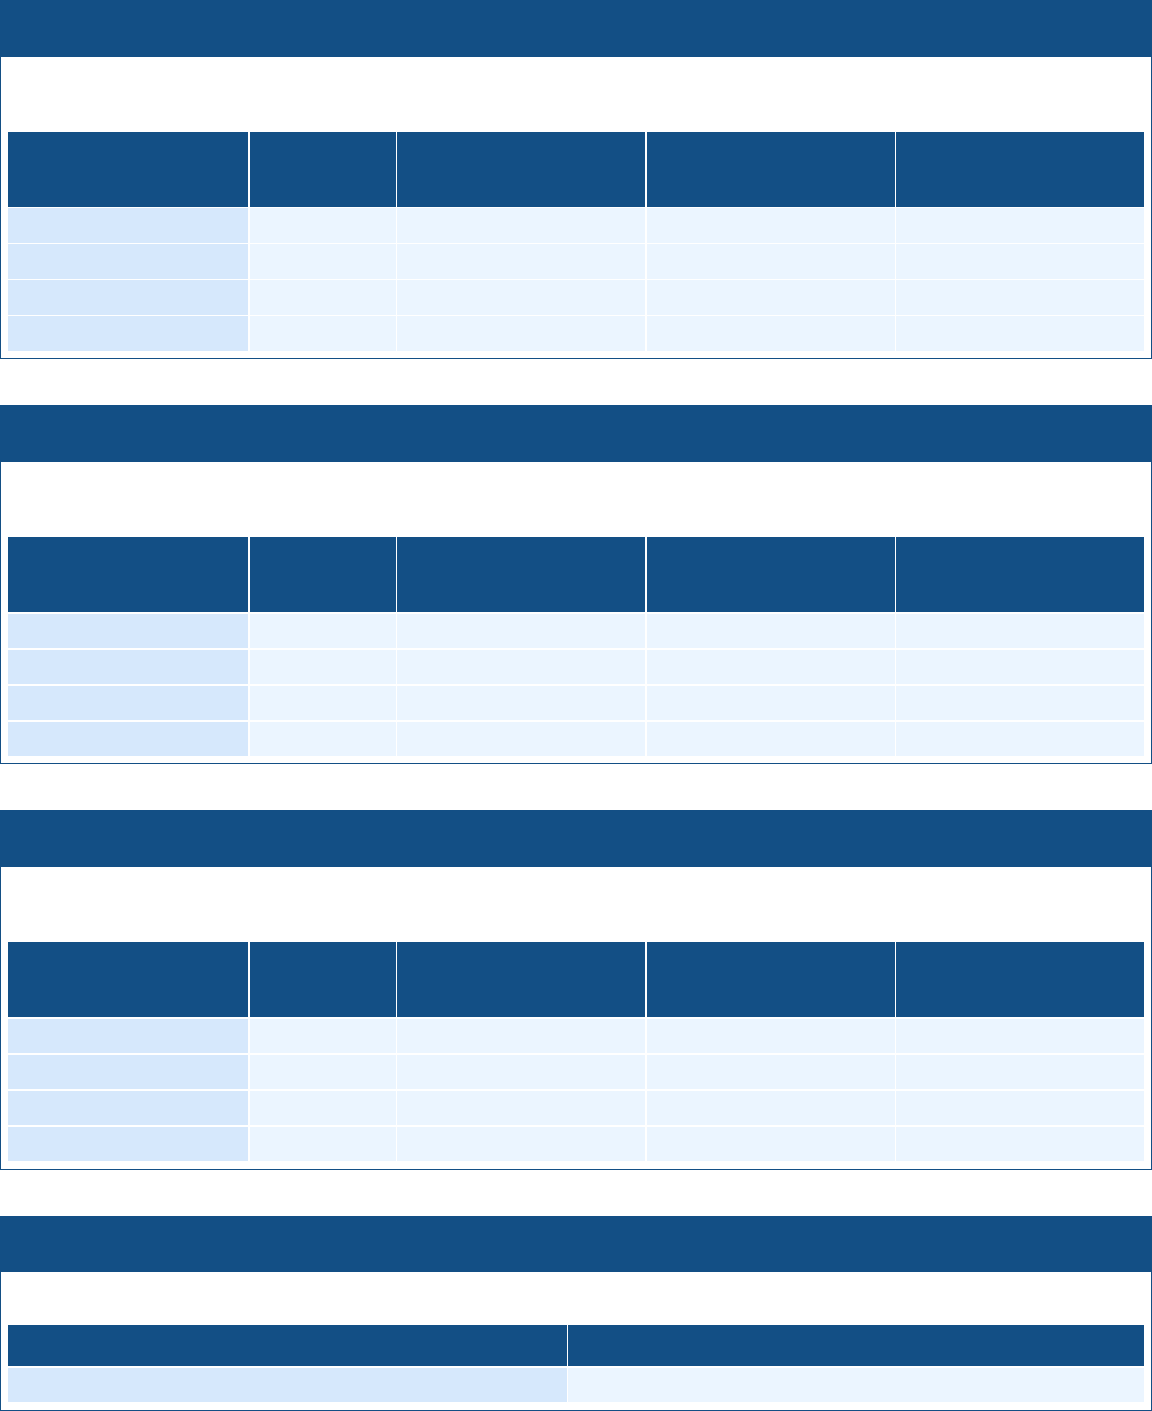
2020-21 Secondary Average Class Size and Class Size Distribution
2020-21 Secondary Average Class Size and Class Size Distribution
This table displays the 2020-21 average class size and class size distribution. The columns titled “Number of Classes” indicates
how many classes fall into each size category (a range of total students per classroom). At the secondary school level, this
information is reported by subject area rather than grade level.
Subject
Average
Class
Size
Number of Classes with
1-22 Students
Number of Classes with
23-32 Students
Number of Classes with
33+ Students
English Language Arts
20
30
39
Mathematics
25
10
31
4
Science
27
7
30
5
Social Science
27
7
33
2
2021-22 Secondary Average Class Size and Class Size Distribution
2021-22 Secondary Average Class Size and Class Size Distribution
This table displays the 2021-22 average class size and class size distribution. The columns titled “Number of Classes” indicates
how many classes fall into each size category (a range of total students per classroom). At the secondary school level, this
information is reported by subject area rather than grade level.
Subject
Average
Class
Size
Number of Classes with
1-22 Students
Number of Classes with
23-32 Students
Number of Classes with
33+ Students
English Language Arts
20
29
37
1
Mathematics
26
9
28
7
Science
26
10
32
2
Social Science
27
6
38
1
2022-23 Secondary Average Class Size and Class Size Distribution
2022-23 Secondary Average Class Size and Class Size Distribution
This table displays the 2022-23 average class size and class size distribution. The columns titled “Number of Classes” indicates
how many classes fall into each size category (a range of total students per classroom). At the secondary school level, this
information is reported by subject area rather than grade level.
Subject
Average
Class
Size
Number of Classes with
1-22 Students
Number of Classes with
23-32 Students
Number of Classes with
33+ Students
English Language Arts
22
25
33
4
Mathematics
27
9
29
4
Science
28
4
37
1
Social Science
29
2
33
6
2022-23 Ratio of Pupils to Academic Counselor
2022-23 Ratio of Pupils to Academic Counselor
This table displays the ratio of pupils to Academic Counselor. One Full Time Equivalent (FTE) equals one staff member working
full time; one FTE could also represent two staff members who each work 50 percent of full time.
Title
Ratio
Pupils to Academic Counselor
307.63
2023 School Accountability Report Card Page 21 of 23 Miramonte High School
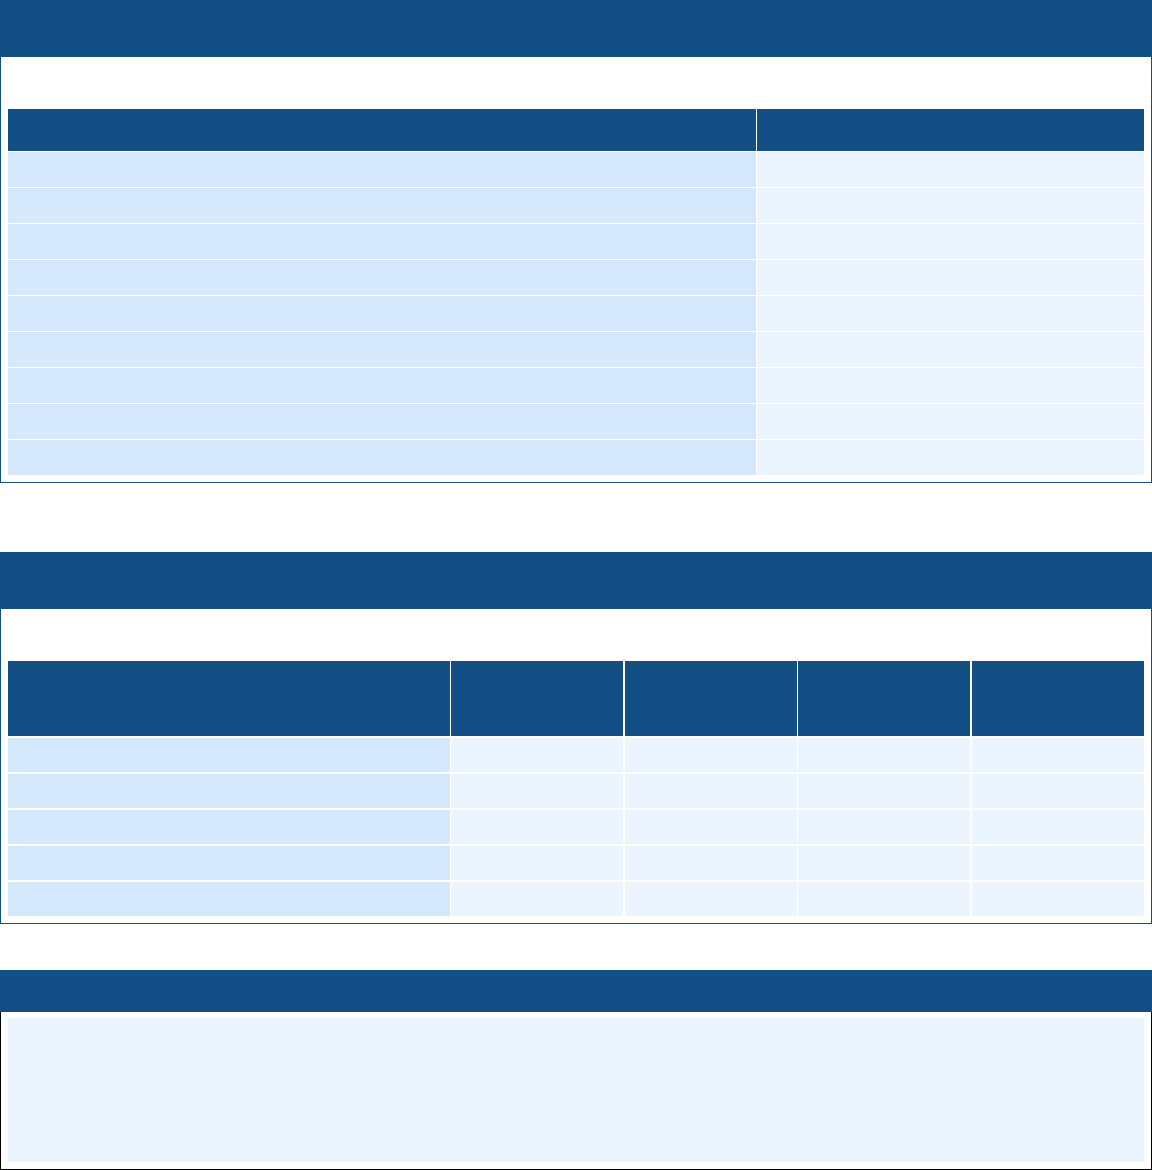
2022-23 Student Support Services Staff
2022-23 Student Support Services Staff
This table displays the number of FTE support staff assigned to this school. One Full Time Equivalent (FTE) equals one staff
member working full time; one FTE could also represent two staff members who each work 50 percent of full time.
Title
Number of FTE Assigned to School
Counselor (Academic, Social/Behavioral or Career Development)
3.8
Library Media Teacher (Librarian)
1
Library Media Services Staff (Paraprofessional)
Psychologist
3
Social Worker
1
Nurse
0.5
Speech/Language/Hearing Specialist
Resource Specialist (non-teaching)
Other
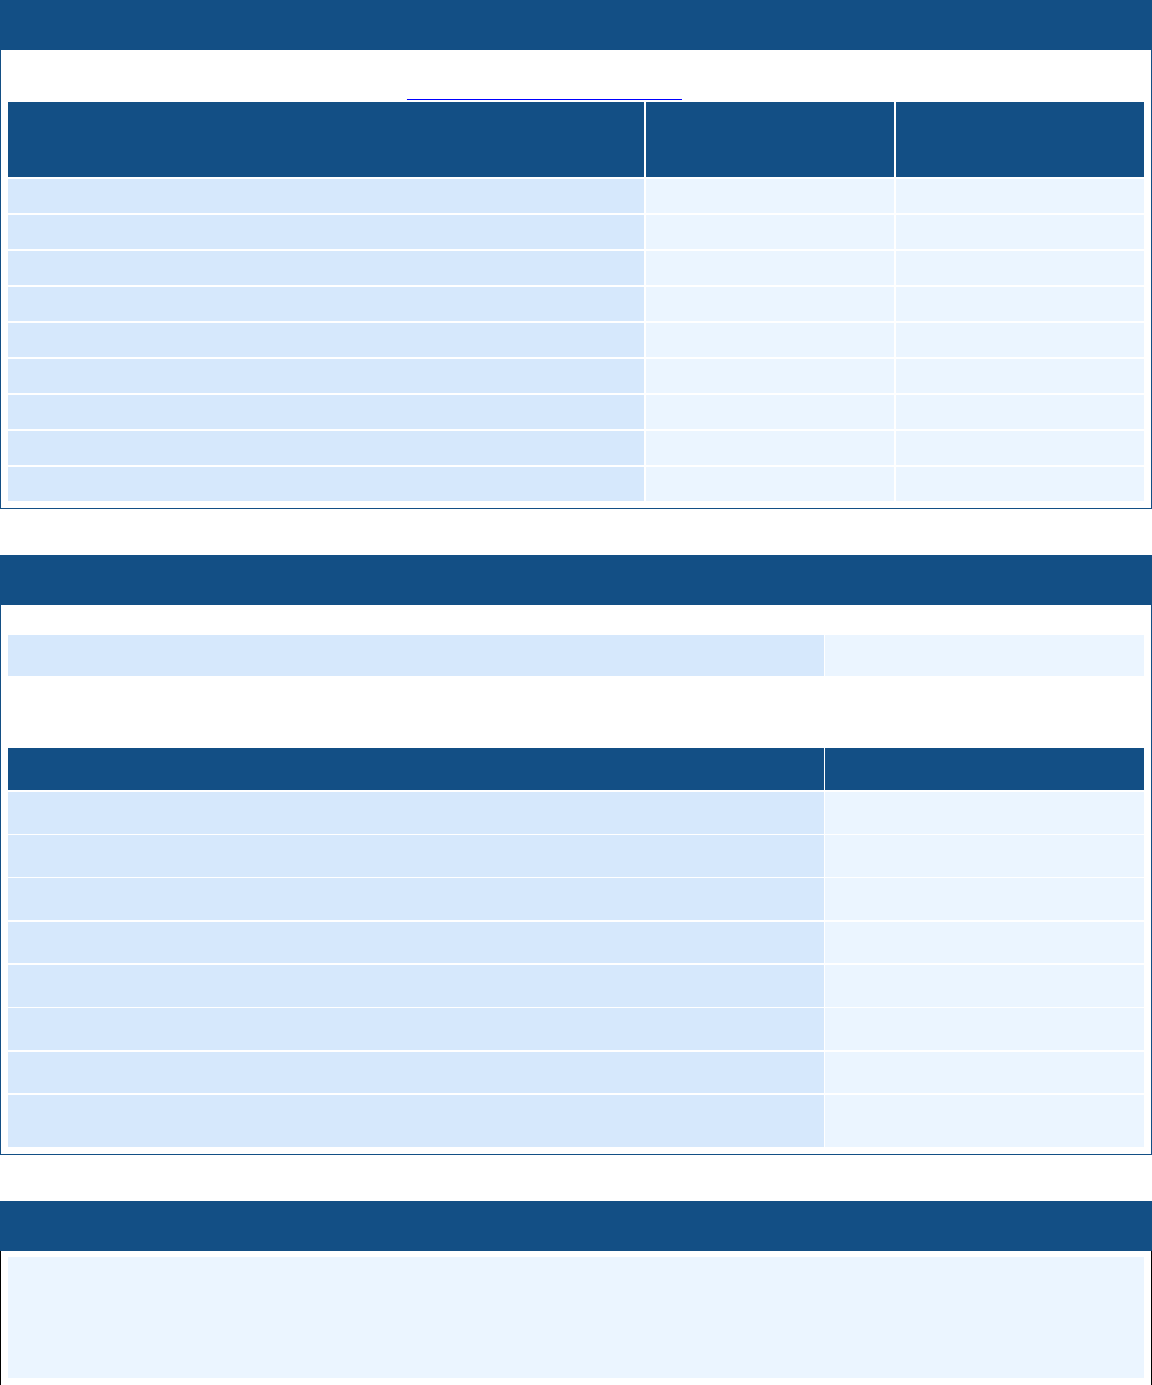
2021-22 Expenditures Per Pupil and School Site Teacher Salaries
Fiscal Year 2021-22 Expenditures Per Pupil and School Site Teacher Salaries
This table displays the 2021-22 expenditures per pupil and average teacher salary for this school. Cells with N/A values do not
require data.
Level
Total
Expenditures
Per Pupil
Expenditures
Per Pupil
(Restricted)
Expenditures
Per Pupil
(Unrestricted)
Average
Teacher
Salary
School Site
$18,296
$6,022
$12,274
$97,785
District
N/A
N/A
$12,065
$100,235
Percent Difference - School Site and District
N/A
N/A
1.7
0.3
State
N/A
N/A
$7,607
$97,850
Percent Difference - School Site and State
N/A
N/A
60.2
3.8
2022-23 Types of Services Funded
Fiscal Year 2022-23 Types of Services Funded
Miramonte is part of a generous community that places a high value on education. Funding from three organizations,
Miramonte Parents' Club, Orinda Network for Education (ONE), and athletic Boosters, enhance student programs and provide
intervention for struggling students around our three areas of focus: excellent teaching, student support, and a safe and healthy
culture and climate. Specifically, these funds are used for maintaining a seven period day, tutoring, math intervention, writing
lab, science intervention, music and voice coaches, support counseling, study skills, technology, library materials,
college/career center resources, instructional supplies and staff development.--------
2023 School Accountability Report Card Page 22 of 23 Miramonte High School
2021-22 Teacher and Administrative Salaries
Fiscal Year 2021-22 Teacher and Administrative Salaries
This table displays the 2021-22 Teacher and Administrative salaries. For detailed information on salaries, see the CDE
Certification Salaries & Benefits web page at http://www.cde.ca.gov/ds/fd/cs/.
Category
District
Amount
State Average
for Districts
in Same Category
Beginning Teacher Salary
$57,041
$57,234
Mid-Range Teacher Salary
$91,053
$95,467
Highest Teacher Salary
$116,563
$122,669
Average Principal Salary (Elementary)
$0
Average Principal Salary (Middle)
$0
$153,476
Average Principal Salary (High)
$164,789
$173,198
Superintendent Salary
$299,500
$277,572
Percent of Budget for Teacher Salaries
34.71%
31.17%
Percent of Budget for Administrative Salaries
4.65%
4.46%
2022-23 Advanced Placement (AP) Courses
2022-23 Advanced Placement (AP) Courses
This table displays the percent of student in AP courses at this school.
Percent of Students in AP Courses
56.6
This table displays the number of AP courses offered at this school where there are student course enrollments of at least one
student.
Subject
Number of AP Courses Offered
Computer Science
6
English
5
Fine and Performing Arts
2
Foreign Language
5
Mathematics
9
Science
13
Social Science
20
Total AP Courses Offered
Where there are student course enrollments of at least one student.
60
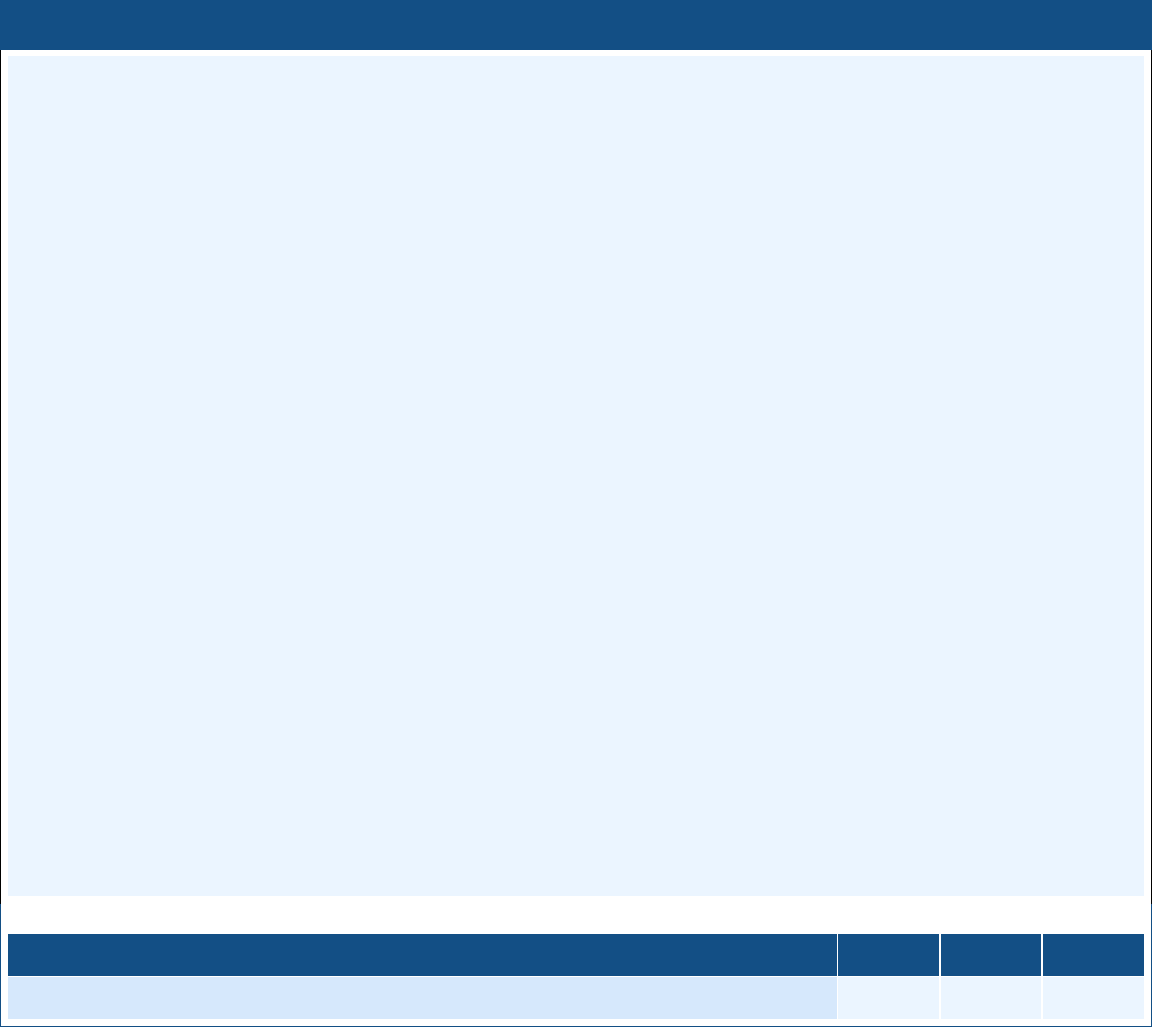
Professional Development
Professional Development
The Acalanes Union High School District (AUHSD) utilizes an engaging and inclusive model of professional development.
Working closely with teacher leaders and site administration, the Educational Services Department collaborates with teacher
leaders and site administrators to implement professional development programming that matches priorities identified through
teacher feedback, student performance data, and the Local Control and Accountability Plan. To provide effective professional
development, AUHSD utilizes experts from the Contra Costa County Office of Education, private consultancy groups, and local
2023 School Accountability Report Card Page 23 of 23 Miramonte High School
Professional Development
universities; in addition, AUHSD teachers and administrators frequently lead professional development sessions. Professional
development opportunities in AUHSD include the following:
• Annual District and site-based professional development days (3 full days per year)
• Summer Institute (3 days) prior to the start of the school year
• Summer curriculum development sessions
• District and site-based curricular release days
• Wednesday and Friday morning site-based meetings
• Districtwide optional professional development days
• Districtwide after-school curricular projects
• Sessions led by instructional coaches – Teachers on Special Assignment
• Regional and national conferences and workshops (in-person and online)
• Training related to new standards and curriculum
As AUHSD staff participate in several initiatives related to curriculum, instruction, and student engagement, recent professional
development sessions have addressed the following topics:
• Curriculum Development
• Course content and standards for English language arts, mathematics, science, and social studies
• Development of a new Ethnic Studies course
• Refinement of the Human and Social Development course
• Introduction of data science into the mathematics course pathways
• Learning Theory and Instructional Strategies
• Science behind student learning
• Effective instructional strategies, especially for the 90-minute class sessions
• Infusing 1:1 technology in the classroom to increase engagement and learning
• Expansion of project-based learning
• Grading practices that foster engagement and learning
• Academic Intervention
• Identifying needs of students not performing at standard
• Targeted academic interventions for students earning grades below a “C”
• Classroom and schoolwide systems for academic intervention
• Social Emotional Wellbeing
• Strategies to foster classrooms characterized by positive connections and support
• Social emotional learning strategies that help address issues related to academic stress
AUHSD is also continuing to provide professional development that fosters inclusion and belonging for all staff and students.
-------
This table displays the number of school days dedicated to staff development and continuous improvement.
Subject
2021-22
2022-23
2023-24
Number of school days dedicated to Staff Development and Continuous Improvement
3
3
3
