Where California High School
Students Attend College
Michal Kurlaender
Sherrie Reed
Kramer Cohen
Matt Naven
Paco Martorell
Scott Carrell
December, 2018
Policy Analysis for California Education
Acknowledgements
This report is part of an ongoing collaboration between researchers at the University of
California, Davis and the California Department of Education exploring college and career
readiness.
The research reported here was supported through the generosity of the Stupski Foundation
and by the Institute of Education Sciences, U.S. Department of Education, through Grant
R305E15000 to the Regents of the University of California. The opinions expressed are
those of the authors and do not represent views of the Stupski Foundation, the Institute of
Education Sciences or the U.S. Department of Education, or of the state agencies providing
the data.
Where California High School
Students Attend College
Michal Kurlaender
Sherrie Reed
Kramer Cohen
Matt Naven
Paco Martorell
Scott Carrell
University of California, Davis
Executive Summary
For as much as we know about the economic benefits of a college degree,
California policymakers and educators have little information about the college destinations
of high school graduates. To fill this information gap, we assembled a unique data set of
three recent cohorts of public high school students matched with college enrollment data
from the National Student Clearinghouse. This report, a product of a partnership with the
California Department of Education, details where California public high school students
attend college and how college attendance and destinations vary by county.
• Among California public high school students, 63% enroll in college following
high school graduation.
• 26% of high school students enroll in a four-year college.
• 37% of high school students enroll in a two-year college.
• Among California public high school students who enroll in college:
• 28% enroll in public four-year campuses in-state (18% at CSU, 10% at UC).
• 57% enroll in public two-year in-state community colleges.
• 4% enroll in private in-state colleges, predominately four-year institutions.
• 11% enroll in out-of-state institutions.
• Only 7% of all high school students (or 11% of all students who enroll in college)
leave the state to attend college after high school, these students reach every
state in the nation.
• Substantial disparities in college enrollment exist by student subgroups:
• Female students are more likely to go to college, and more likely to
attend four-year colleges, than male students.
• Students from socioeconomically disadvantaged backgrounds enroll in
college at lower rates than their more advantaged peers.
• College enrollment, particularly by higher education sector, varies by
race/ethnicity.
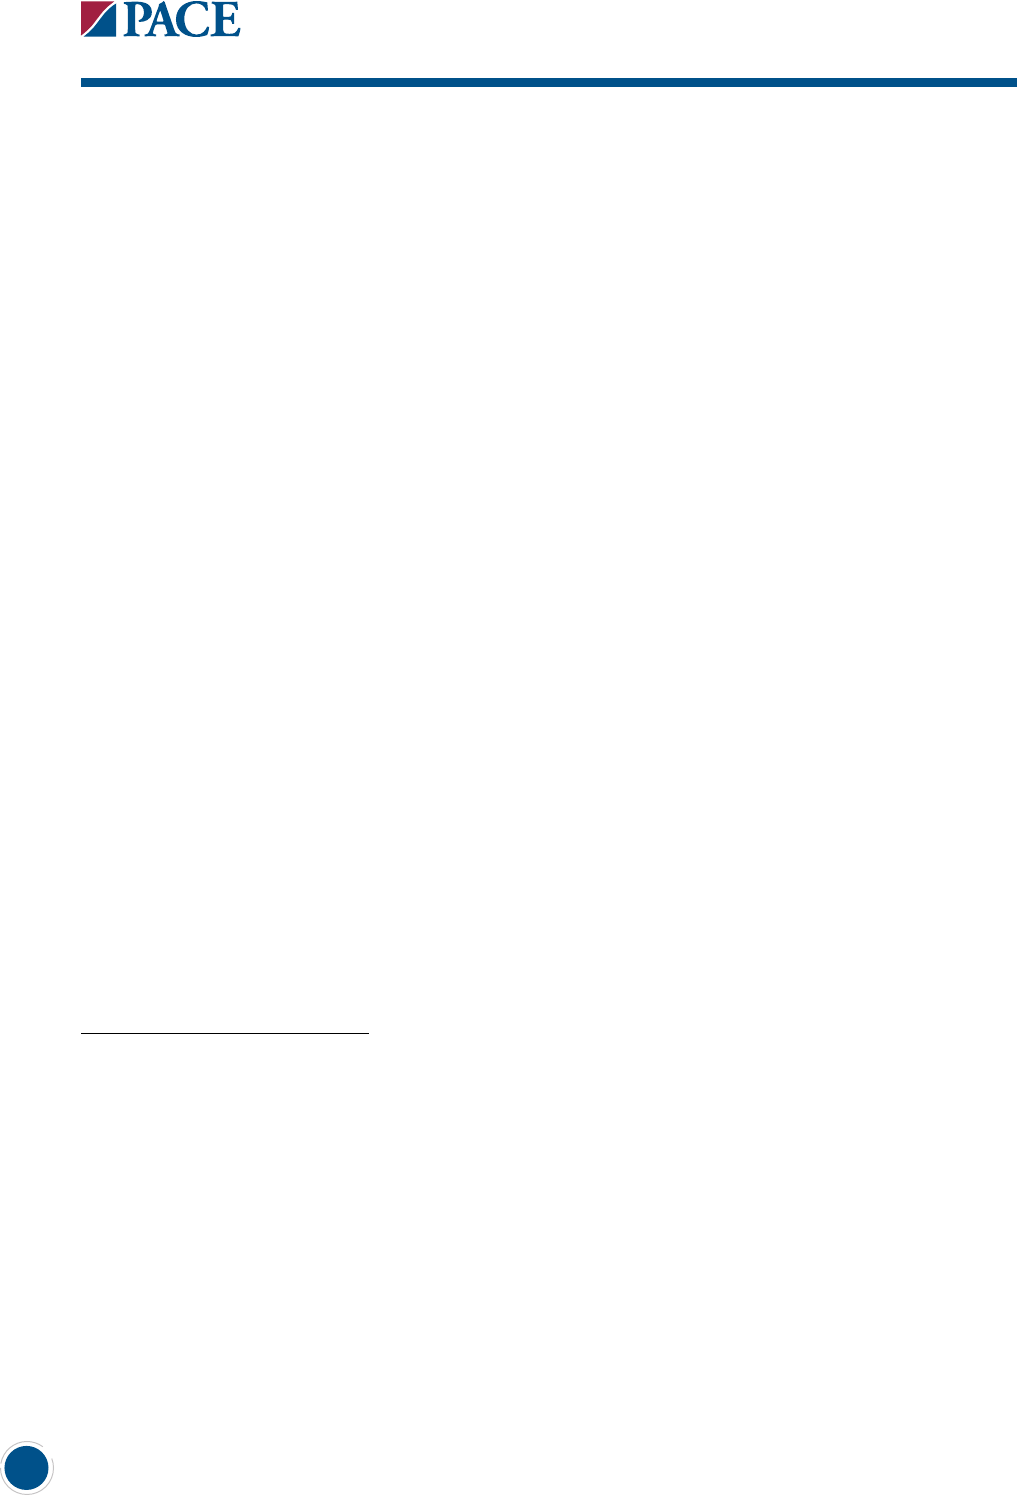
37%
No College
26%
4-Year College
37%
2-Year College
of California Public High School Students Enroll in College after Graduation
63%
edpolicyinca.org
Policy Analysis for California Education
1
Introduction
Today, a college degree is more important than ever before. The education
earnings premium, as it is often referred to, has grown tremendously over the past
several decades, and college degree attainment is the surest way to safeguard economic
prosperity for individuals and for society at large. High school students have largely
registered the college refrain, and, as such, enrollment continues to rise. Total enrollment
in public colleges and universities in the U.S. increased by 11% since 2006 (from 9.4 million
to 10.4 million), and by 13% in California during this time period (College Board, 2018).
Despite the importance of postsecondary schooling, today’s leaders and California’s
educators in school systems across the state lack basic information about the college
destinations of our youth (Phillips, Reber, & Rothstein, 2018; California Competes, 2018).
This report aims to fill some of this gap by providing statistics on where California public
high school students attend college and how these college destinations vary in counties
across the state. These statistics have not been available at the state level in nearly
a decade.
1
The report leverages a unique data set from the California Department of
Education on the census of high school students, which we matched to college enrollment
data from the National Student Clearinghouse. Specifically, we detail college enrollment
for all California public high school students by key student subgroups and by county.
We focus on enrollment by degree type (two-year/four-year), sector (public/private), and
location (in-state/out-of-state).
1
The most recent high school graduation cohort for which college enrollment data was obtained from National Student
Clearinghouse and reported by the California Department of Education was 2008-2009. In addition, Public Policy Institute
of California released maps of college enrollment in California counites using more limited data in 2010. Available here:
https://www.ppic.org/data-set/maps-of-college-enrollment-rates-in-californias-counties/
Where California High School Students Attend College2
Data and Analysis
The information presented in this report relies on data from multiple sources. The
primary data source is 11th grade student scores on California’s standardized assessments
(i.e., STAR/CST and CAASPP/SBAC) along with demographic data including gender, race/
ethnicity, a socioeconomic status indicator, and high school of enrollment. We match
these K-12 data to individual-level data on college enrollment obtained from National
Student Clearinghouse for 11th grade students in 2012-2013, 2013-2014, and 2014-2015.
2,3
If on track to complete high school in four years, these student cohorts would have
graduated high school in the spring of 2014, 2015, and 2016 respectively.
Using this merged data set, we examine first-time college enrollment during the first
year and a half following a student’s expected high school graduation (more specifically,
the first institution of attendance following high school completion).
4
Using individual
data, we calculated county-level summary statistics for enrollment at a variety of college
types based on the high school where students took the 11th grade assessment. We also
investigated enrollment patterns for student subgroups.
The Appendix for this report (available online) provides tables of college enrollment
statistics by institution type and by student subgroup for each of the 58 counties in
California.
5
2
For two cohorts we merge to 11th grade assessment data, and for one cohort we merge to assessment data from
prior years.
3
Dynarski, Hemelt, and Hyman (2015) examine the benefits and challenges of working with National Student Clearinghouse
(NSC) data. In particular, they calculate NSC coverage rates—identifying the extent to which students who are enrolled in
college do not appear in NSC—over time, by state, college type, and demographic subgroups. Coverage rates for California
in 2011, the last year reported in Dynarski et al. (2015), rank 25 out of 50 states and DC at 93%.
4
As students may be enrolled for multiple terms at multiple institutions during the year and a half after their expected high
school graduation, we selected the term and institution for analysis as follows: Records from the first fall term post expected
graduation were prioritized over records from the first spring term over records from the second fall term. If there were not
records from any of these terms, records with the earliest enrollment date were selected. If after limiting a student’s term of
interest for the analysis, there were still multiple records to choose from, records from four-year colleges were prioritized
over records from two-year colleges over records from less than two year institutions. If there were still multiple records for
a student, records were sorted first by enrollment start date and then by enrollment end date, with the first record kept.
5
We report summary statistics of institutional types by subgroups when enrollment meets our minimum reporting
requirements (>15). All enrollment numbers—in addition to the percentages reported here—are available in the Appendix
(available online).
edpolicyinca.org
Policy Analysis for California Education
3
College Enrollment
College Enrollment: Two-Year and Four-Year
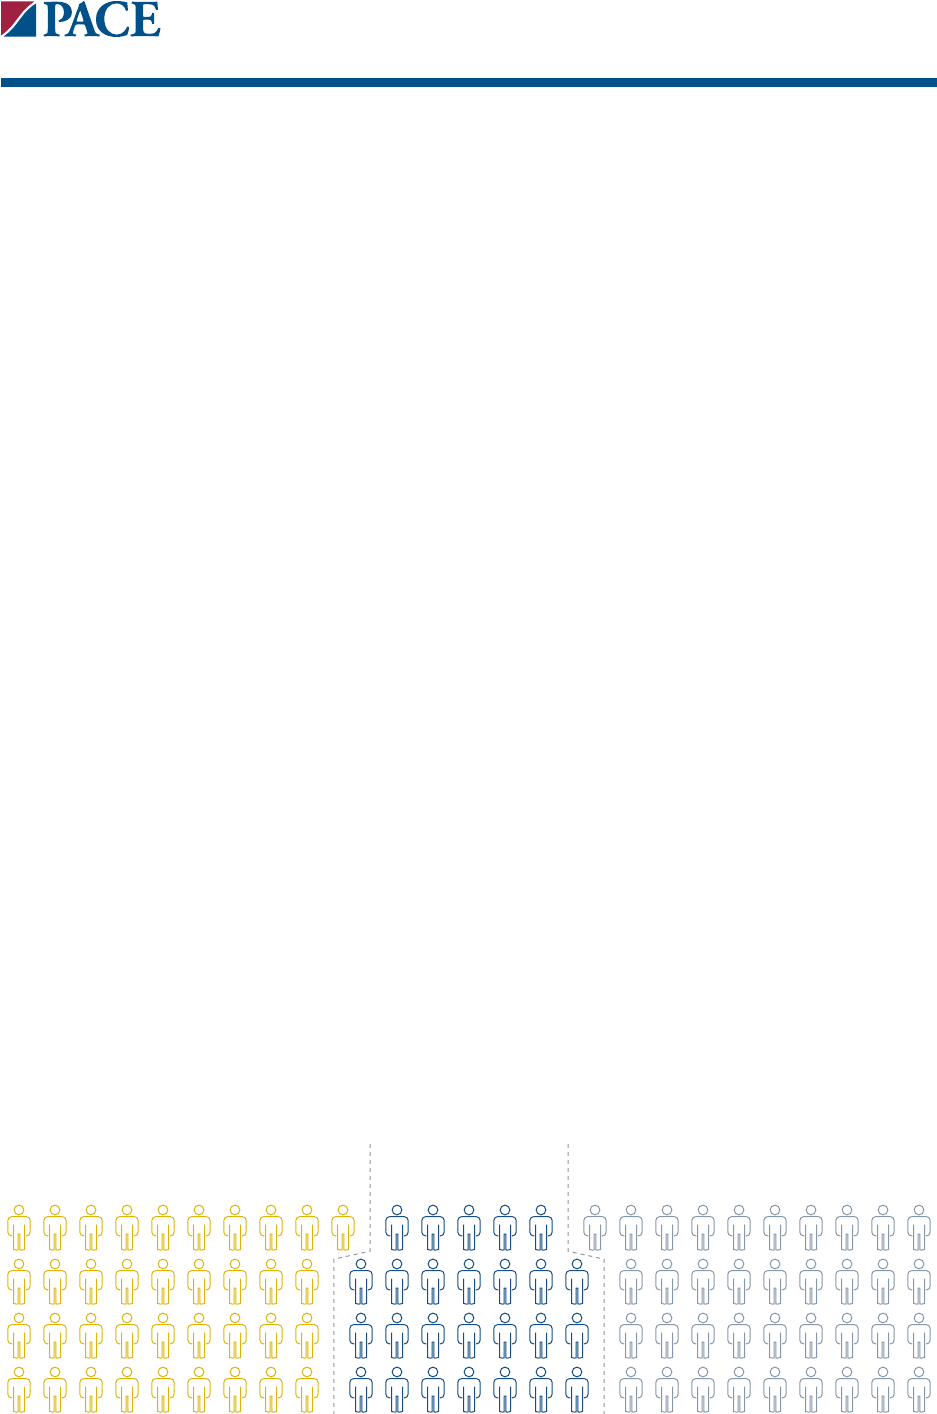
Across California, 63% of public high school 11th graders enroll in college in
the year and a half following high school graduation (Figure 1). About 26% of high school
students enroll in a four-year college and 37% enroll in a two-year college.
Figure 1: College Enrollment Rates of California Public High School Students
College Enrollment: In-State and Out-of-State Among Enrollees
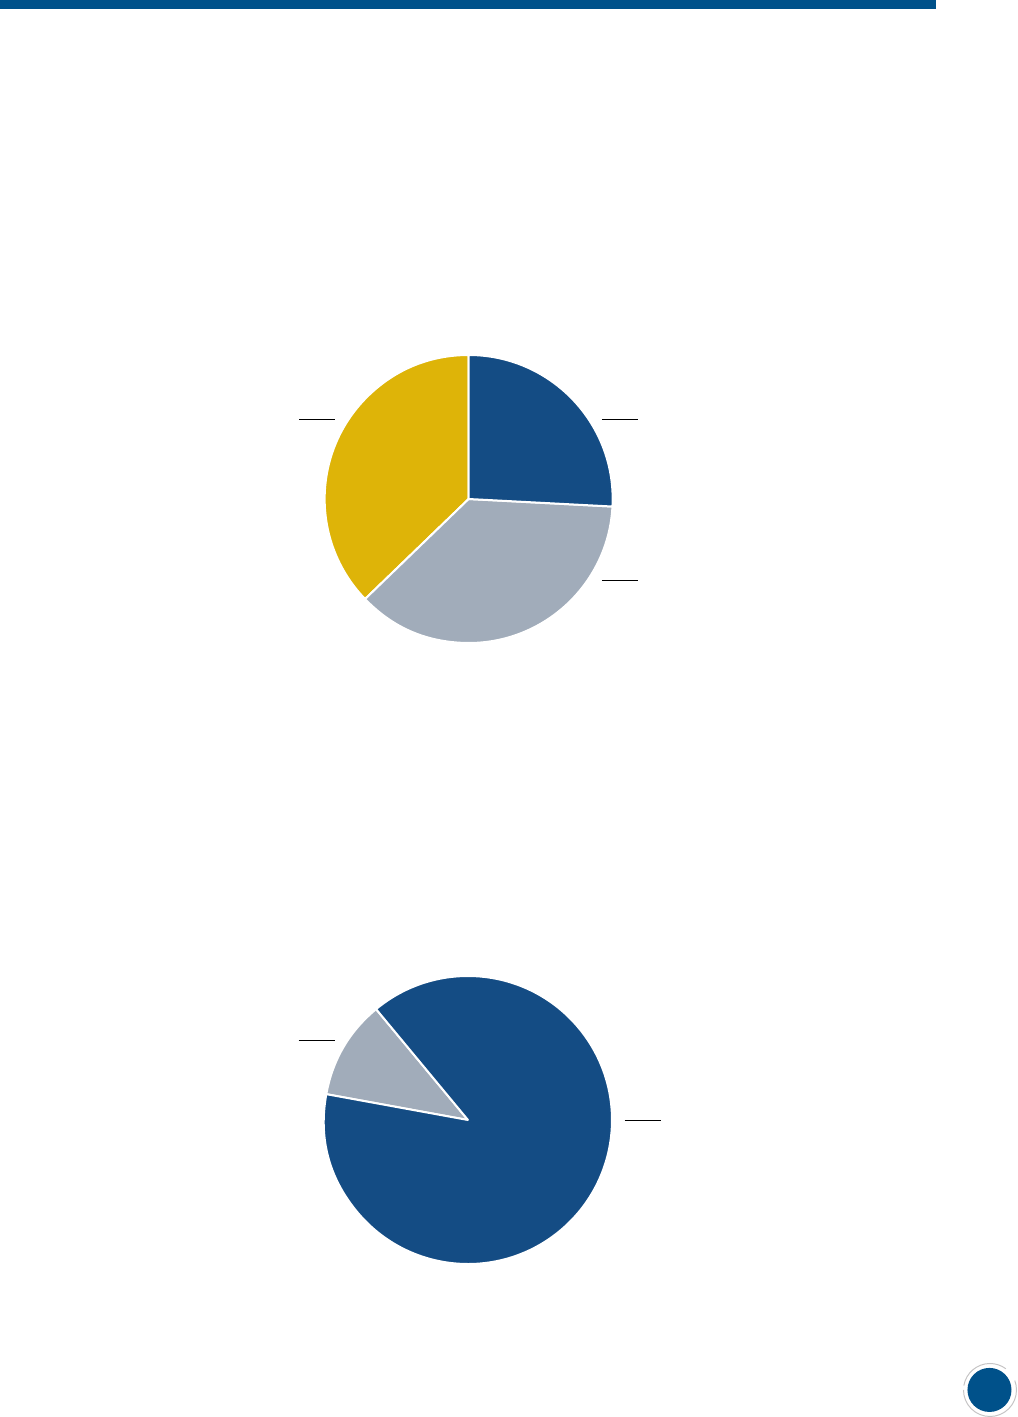
Of the students who enroll in college, almost all (89%) enroll at campuses within
the state of California (Figure 2). Only 11% of students from California public high schools
attend college at out-of-state institutions.
Figure 2: In-State and Out-of-State Enrollment of California Public High School Students
Who Enroll in College
26%
4-Year College
37%
2-Year College
37%
No College
89%
In-State
11%
Out-of- State
Where California High School Students Attend College4
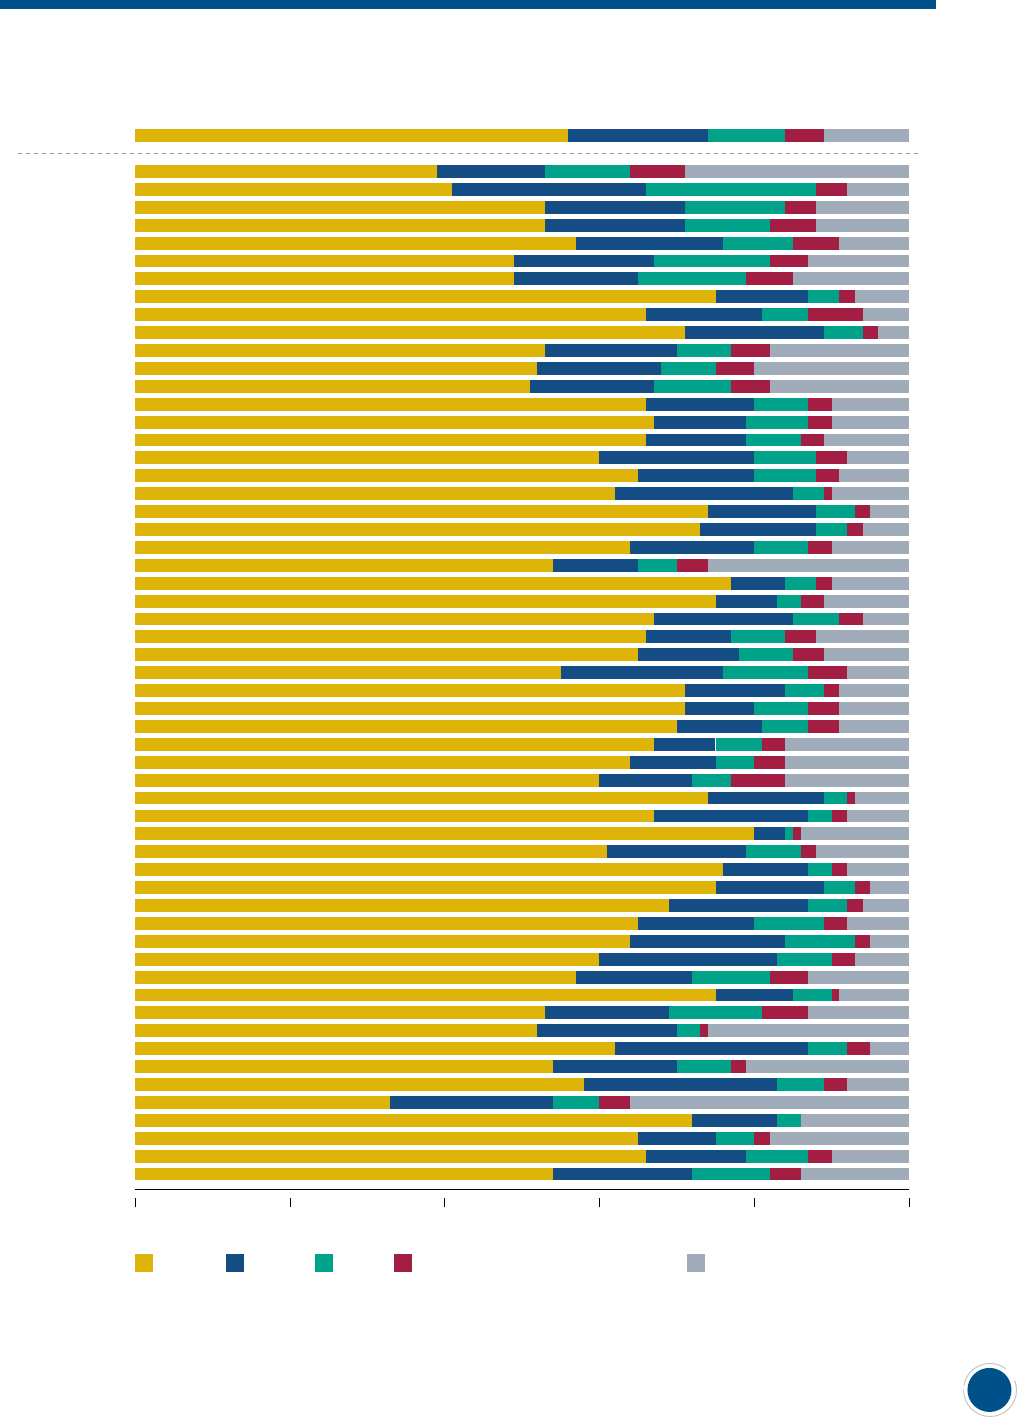
College Enrollment: Two-Year and Four-Year, Public and Private, Out-of-State
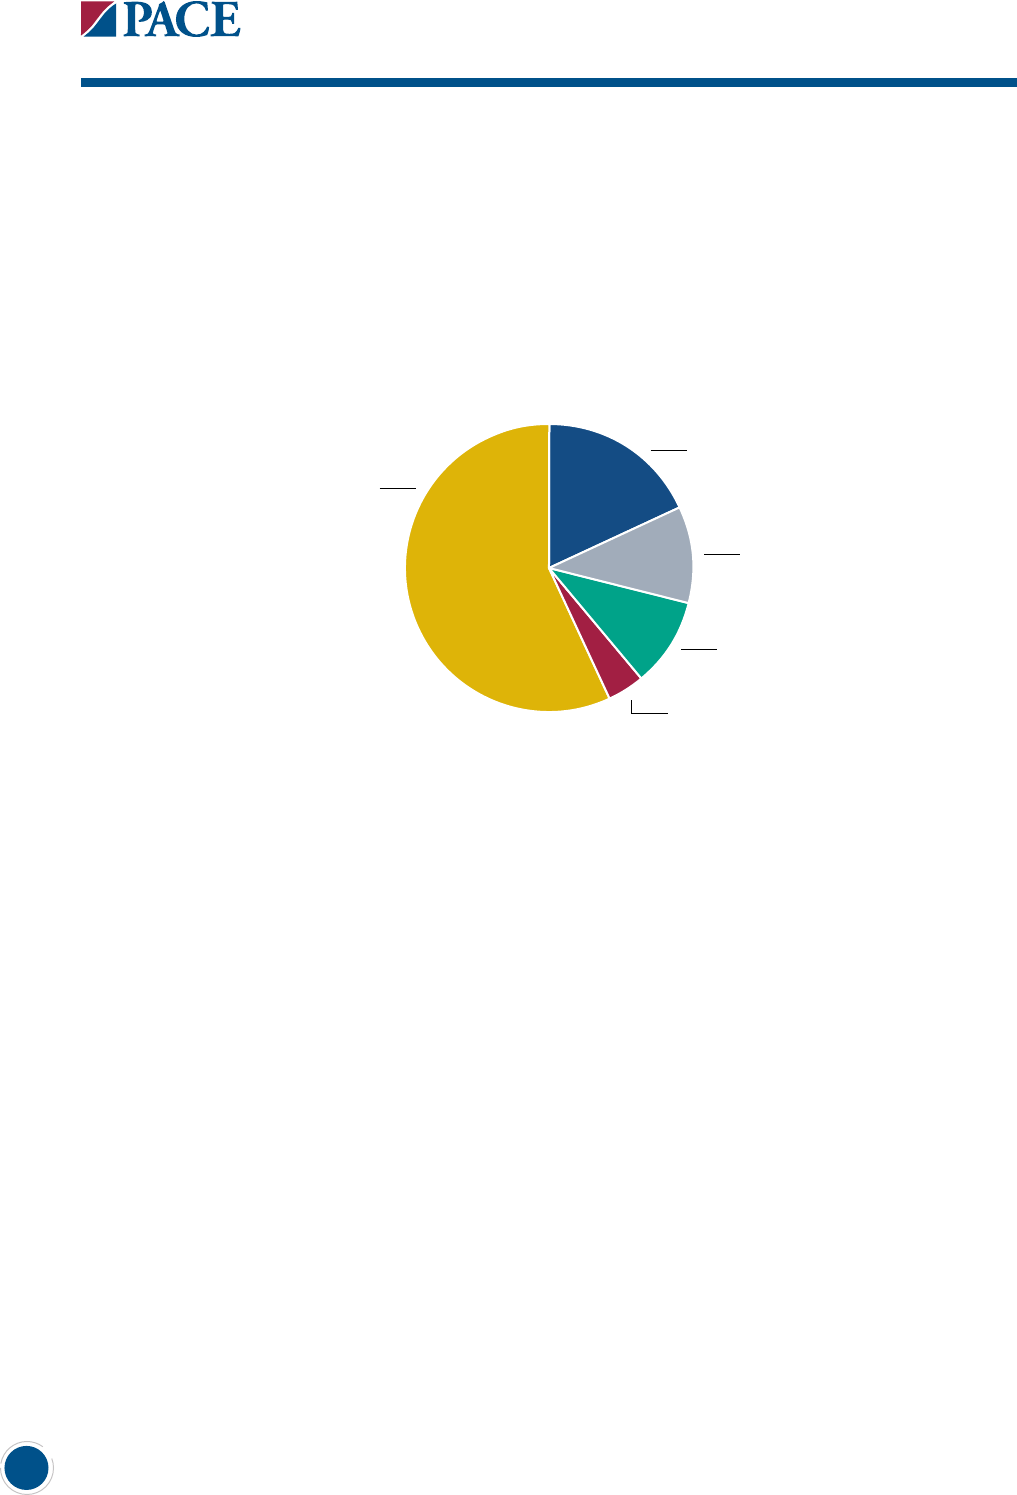
Among all California public high school students who enroll in college, 28% enroll
in public four-year campuses in-state (18% at CSU, 10% at UC), 57% enroll in public two-
year in-state community colleges, and an additional 4% enroll in private in-state colleges
(the vast majority of in-state private institutions are four-year) (Figure 3).
Figure 3: Institution of Enrollment of California Public High School Students Who Enroll
in College
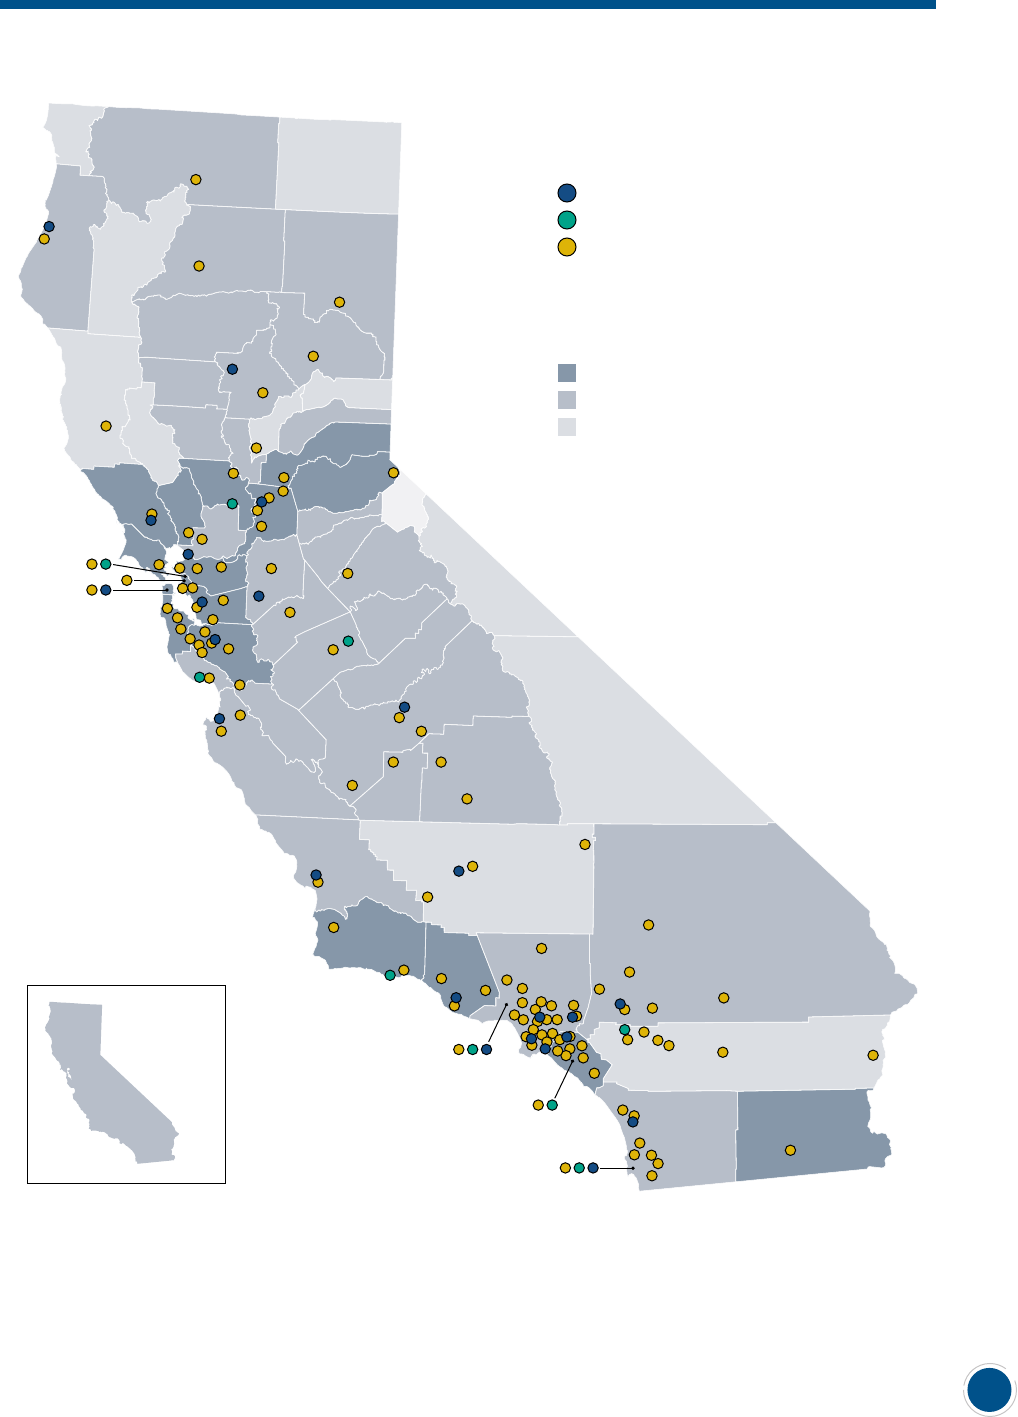
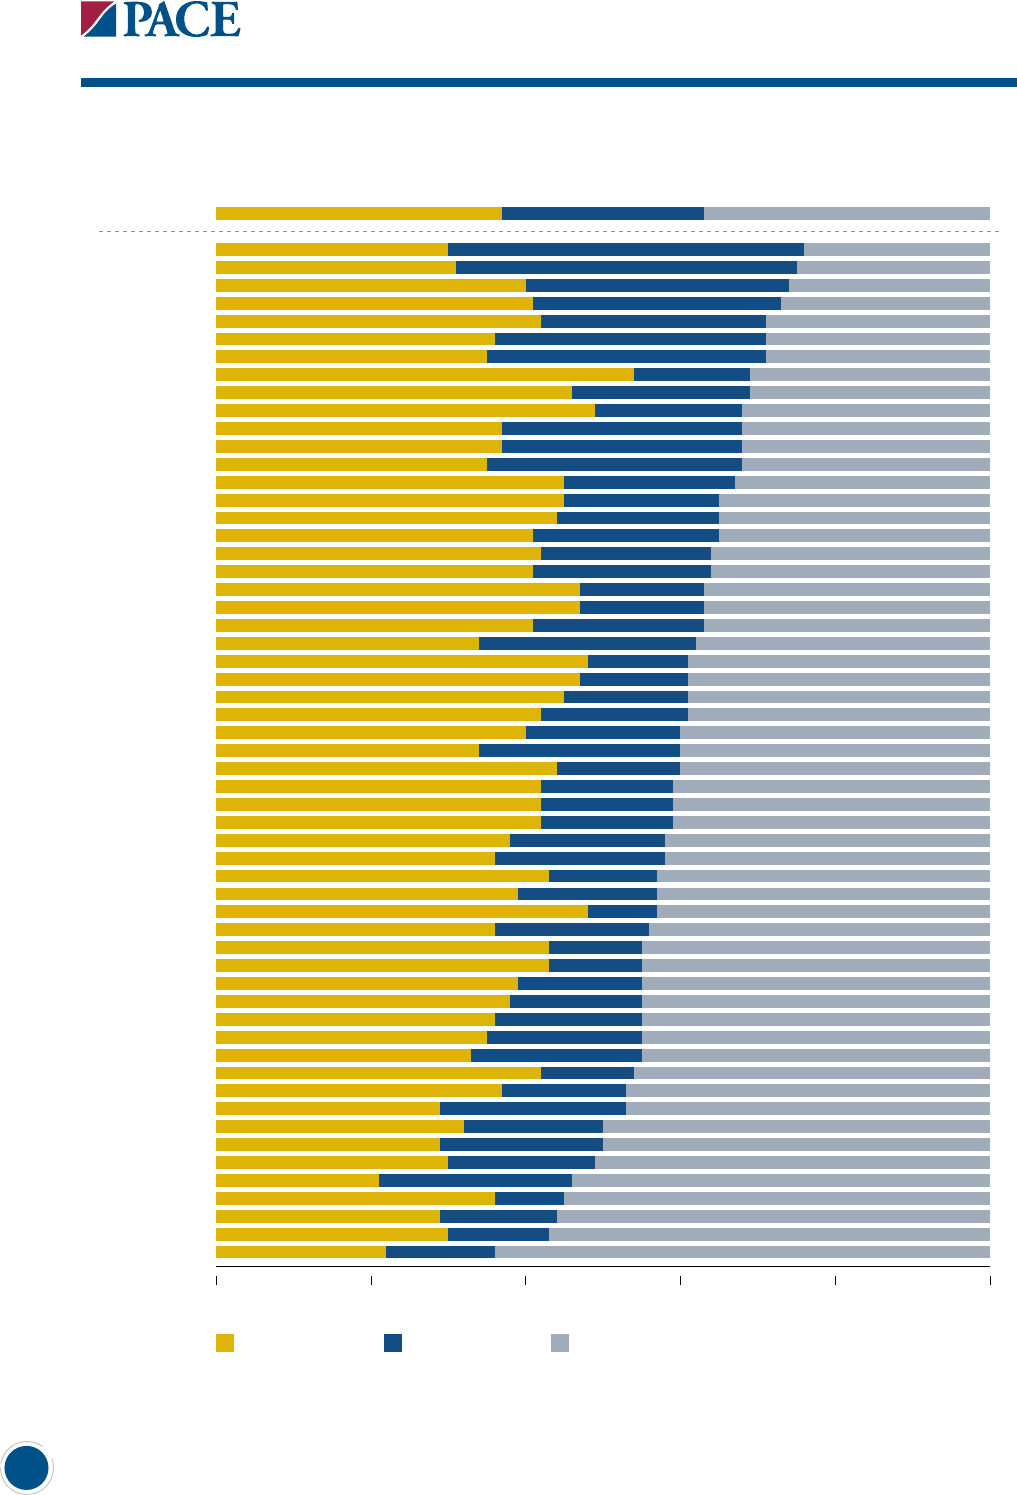
College Enrollment Varies Across Counties
The proportion of California public high school students who enroll in college
following graduation varies across counties (Figure 4). For example, 75% of high school
students from Marin County and San Francisco County high schools enroll in college,
whereas only 36% of students from Inyo County high schools enroll in college after
high school completion. A similar pattern is observed when comparing the proportion
of students that enroll in two-year colleges versus four-year colleges (Figure 5). Again,
Marin and San Francisco Counties have the largest proportion of students (46% and 44%,
respectively) enrolling in four-year colleges. In contrast, Imperial County has the highest
rate of two-year college enrollment at 54%.
18%
California State
University
57%
California
Community
College
10%
University of California
4%
Private In-State
(2- and 4-Year)
11%
Out-of-State
edpolicyinca.org
Policy Analysis for California Education
5
Figure 4: College Enrollment Rates Across California Counties
California State University
University of California
California Community College
>64%
55% – 64%
<55%
Type of California Public College
Percentage of College-Going
High School Students
California
63%
Note: Alpine County statistics are not depicted in this graph because the number of high school students in each category
does not meet our minimum requirements for reporting.
Where California High School Students Attend College6
Figure 5a: College Enrollment Rates of California Public High School Students,
by County (sorted by overall college enrollment)
Note: Alpine County statistics are not depicted in this graph because the number of high school students in each category
does not meet our minimum requirements for reporting.
2-Year College 4-Year College No College
0 20 40 60 80 100
California
Marin
San Francisco
San Mateo
Placer
Orange
Alameda
Santa Clara
Ventura
Imperial
Contra Costa
Santa Barbara
Napa
Yolo
El Dorado
Sonoma
Sacramento
San Benito
Santa Cruz
Fresno
Monterey
San Luis Obispo
San Diego
Butte
San Joaquin
Kings
Sutter
Plumas
Shasta
Los Angeles
Solano
Tulare
Colusa
Calaveras
Merced
Stanislaus
Mariposa
Lassen
Glenn
Humboldt
Siskiyou
Nevada
San Bernardino
Amador
Tuolumne
Madera
Tehama
Yuba
Modoc
Riverside
Mono
Kern
Trinity
Sierra
Del Norte
Mendocino
Lake
Inyo
edpolicyinca.org
Policy Analysis for California Education
7
Figure 5b: Institution Type of Enrollment of California Public High School Students Who
Enroll in College (sorted by overall college enrollment)
Note: Alpine County statistics are not depicted in this graph because the number of high school students in each category
does not meet our minimum requirements for reporting.
0 20 40 60 80 100
CSU
CCC Out-of-State
UC Private In-State (2- and 4-Year)
California
Marin
San Francisco
San Mateo
Placer
Orange
Alameda
Santa Clara
Ventura
Imperial
Contra Costa
Santa Barbara
Napa
Yolo
El Dorado
Sonoma
Sacramento
San Benito
Santa Cruz
Fresno
Monterey
San Luis Obispo
San Diego
Butte
San Joaquin
Kings
Sutter
Plumas
Shasta
Los Angeles
Solano
Tulare
Colusa
Calaveras
Merced
Stanislaus
Mariposa
Lassen
Glenn
Humboldt
Siskiyou
Nevada
San Bernardino
Amador
Tuolumne
Madera
Tehama
Yuba
Modoc
Riverside
Mono
Kern
Trinity
Sierra
Del Norte
Mendocino
Lake
Inyo
Where California High School Students Attend College8
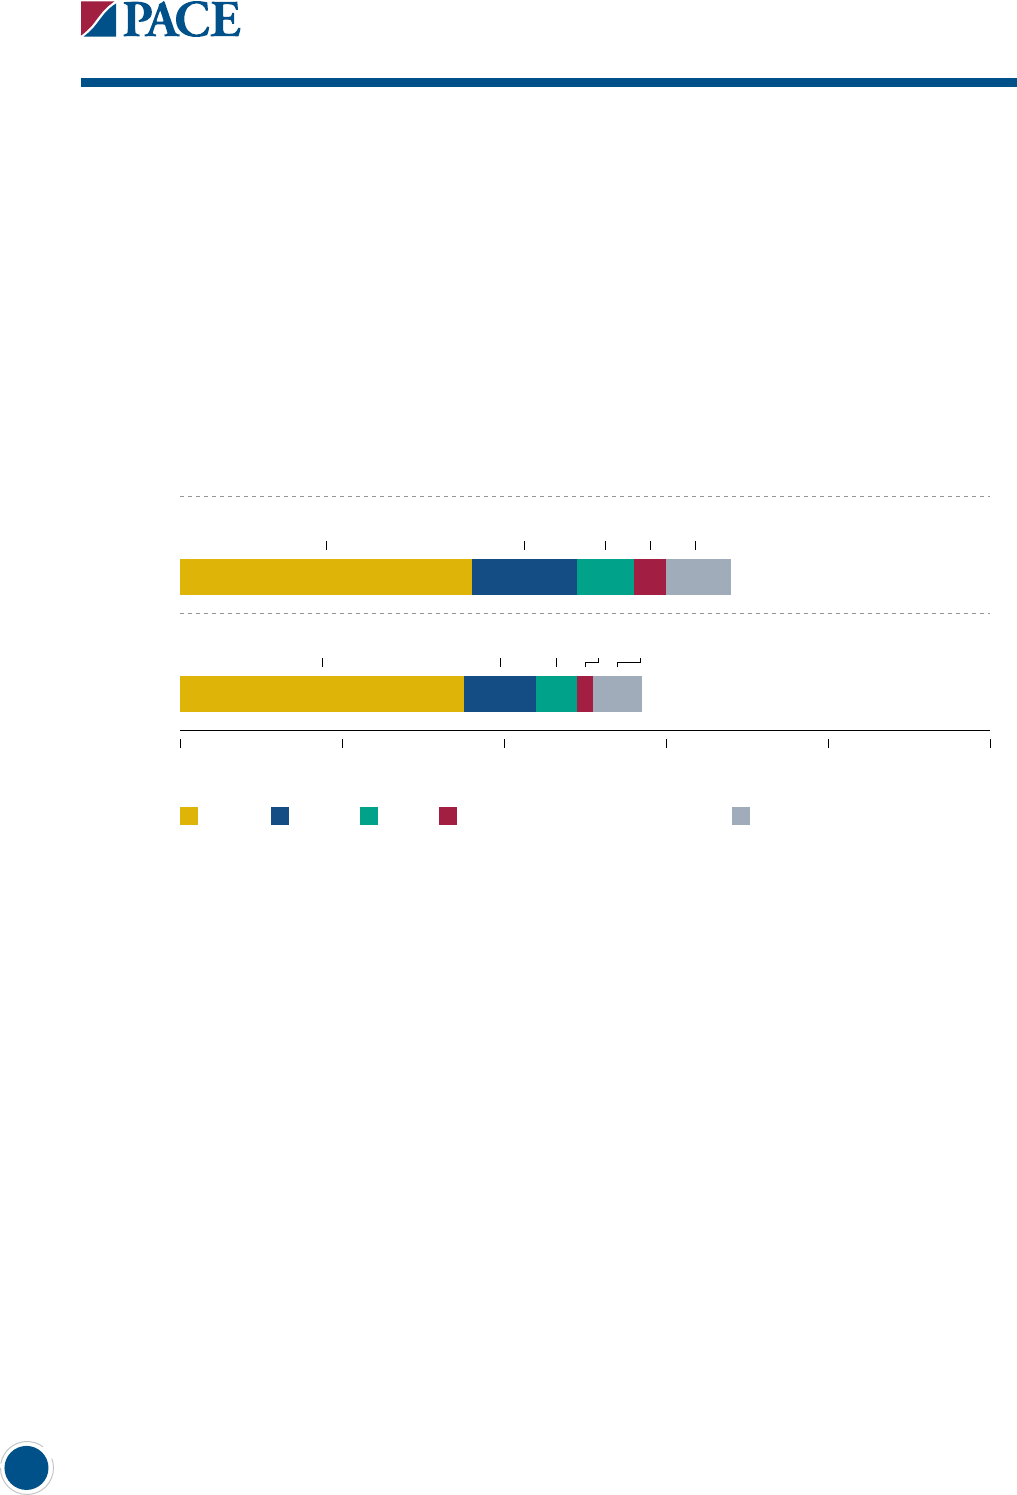
In-State College Enrollment by Student Characteristics
Student Gender
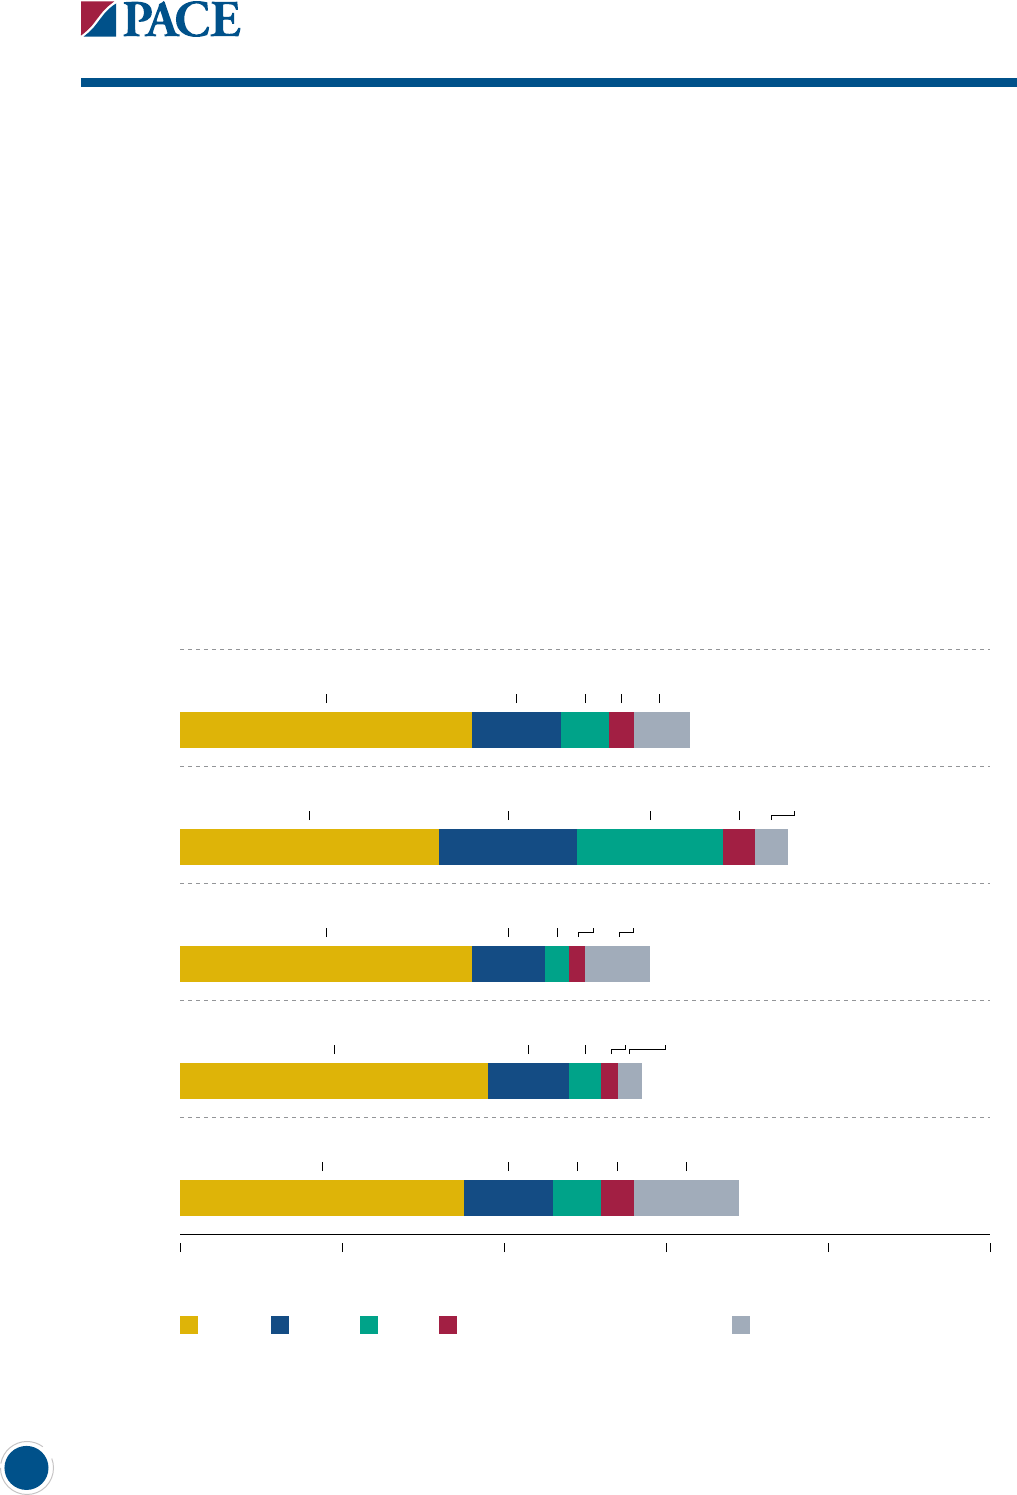
Female students are more likely to go to college than male students (Figure 6).
Approximately 68% of females enroll in college, while 57% of males enroll in college
following high school. This dierence is primarily the result of greater enrollment by female
students in four-year colleges (in-state and out-of-state). In fact, both male and female
students across the state enroll in two-year colleges at nearly the same rate (about 35%).
Figure 6: In-State College Enrollment, by Student Gender
0 20 40 60 80 100
13%
Female
Male
7% 4%36% 8%
9% 5% 6%35% 2%
CSU
CCC Out-of-State
UC Private In-State (2- and 4-Year)
edpolicyinca.org
Policy Analysis for California Education
9
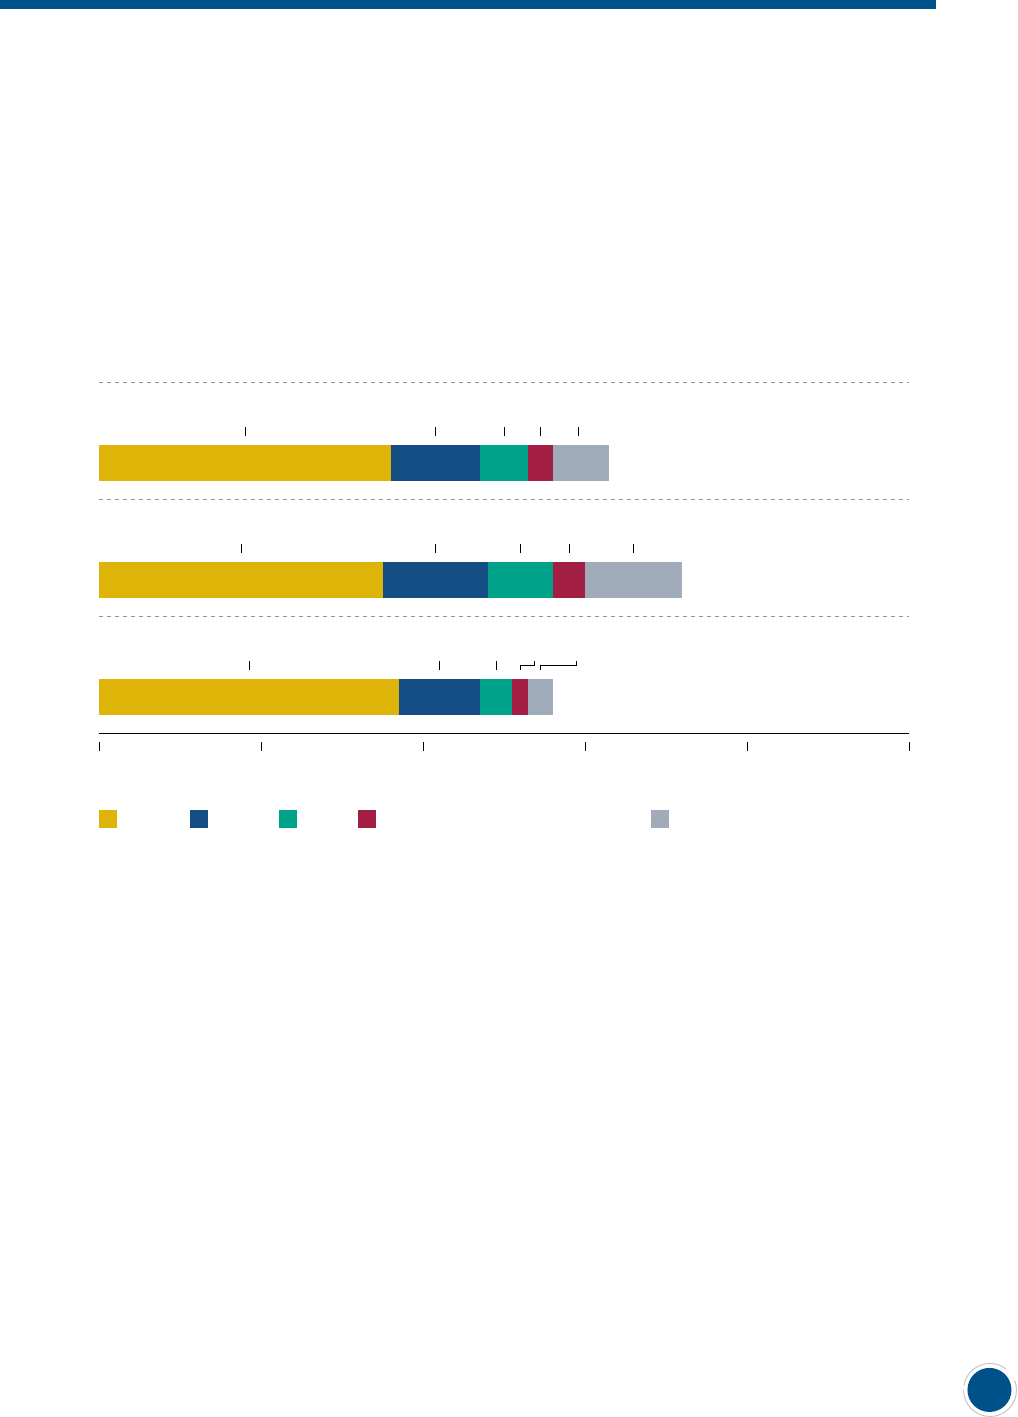
Student Socioeconomic Disadvantage Status
Across the state, students from socioeconomically disadvantaged (SED)
backgrounds enroll in college at lower overall rates than their more advantaged peers,
a dierence of 16 percentage points overall (Figure 7). On average, students from
socioeconomically disadvantaged backgrounds are more likely to enroll in two-year
colleges (37%) than in four-year colleges (18%), whereas among non-socioeconomically
disadvantaged students nearly half enroll in four-year colleges in-state or out-of-state.
Figure 7: In-State College Enrollment, by Student Socioeconomic Disadvantage Status
0 20 40 60 80 100
11%
All
Non-
SED
6% 3%36% 7%
13% 8% 4%35% 12%
SED
10% 4% 2%37% 3%
CSU
CCC Out-of-State
UC Private In-State (2- and 4-Year)
Where California High School Students Attend College10
Race/Ethnicity
College enrollment varies considerably by student race/ethnicity (Figure 8).
Across the state, Asian students enroll in college at higher rates than students from all
other racial/ethnic backgrounds, 78%, as compared to Black students at 58%, Latino
students at 56%, and White students at 69%. Looking at enrollment by sector, we note
that enrollment at the University of California campuses varies substantially by race/
ethnicity, 18% of Asian, 3% of Black, 4% of Latino, and 6% of White students enroll at the
University of California after high school. At the California State University, patterns are
similar, albeit less pronounced: 17% of Asian, 9% of Black, 10% of Latino, and 11% of White
students enroll at the California State University campuses after high school. Overall,
all groups have higher college participation at two-year versus four-year colleges (about
37% enrolling at California Community Colleges), save for Asian students, with a 32%
enrollment at California Community Colleges post-high school.
Figure 8: In-State College Enrollment, by Student Race/Ethnicity
0 20 40 60 80 100
11%
All
Asian/PI
6% 3%36% 7%
17% 18% 4%32%
Black/
Af Am
9% 3%36%
Latino/a
10% 4%38%
White
11% 6% 4%35% 13%
CSU
CCC Out-of-State
UC Private In-State (2- and 4-Year)
7%
2% 3%
2% 8%

edpolicyinca.org
Policy Analysis for California Education
11
Out-of-State College Enrollment
Only 7% of all high school students (or 11% of all students who enroll in college)
from California public high schools leave the state to attend college after high school.
6
However, California students enrolling out-of-state reach every state in the nation. Arizona
takes the lion share of out-of-state enrollees at 14.3%, followed by Oregon at 8.5%. Overall,
the following thirteen states combined represent 70% of all out-of-state enrollment:
Arizona, Oregon, New York, Washington, Texas, Massachusetts, Colorado, Nevada, Utah,
Illinois, Idaho, Pennsylvania, and Indiana.
7
Figure 9: Destinations of California Public High School Students Who Enroll in
Out-of-State Colleges
>5% 2% – 4.99% <2%
6
This represents about 96,000 students from the three cohorts included in this analysis.
7
Less than 2% of students enroll in Western Undergraduate Exchange Colleges, which oer discounted tuition for
California students attending public universities in more than a dozen western states and territories. For a list of colleges
participating in the Western Undergraduate Exchange Colleges (W.U.E.) and to learn more about the program, visit their
website: https://www.wiche.edu/wue
Where California High School Students Attend College12
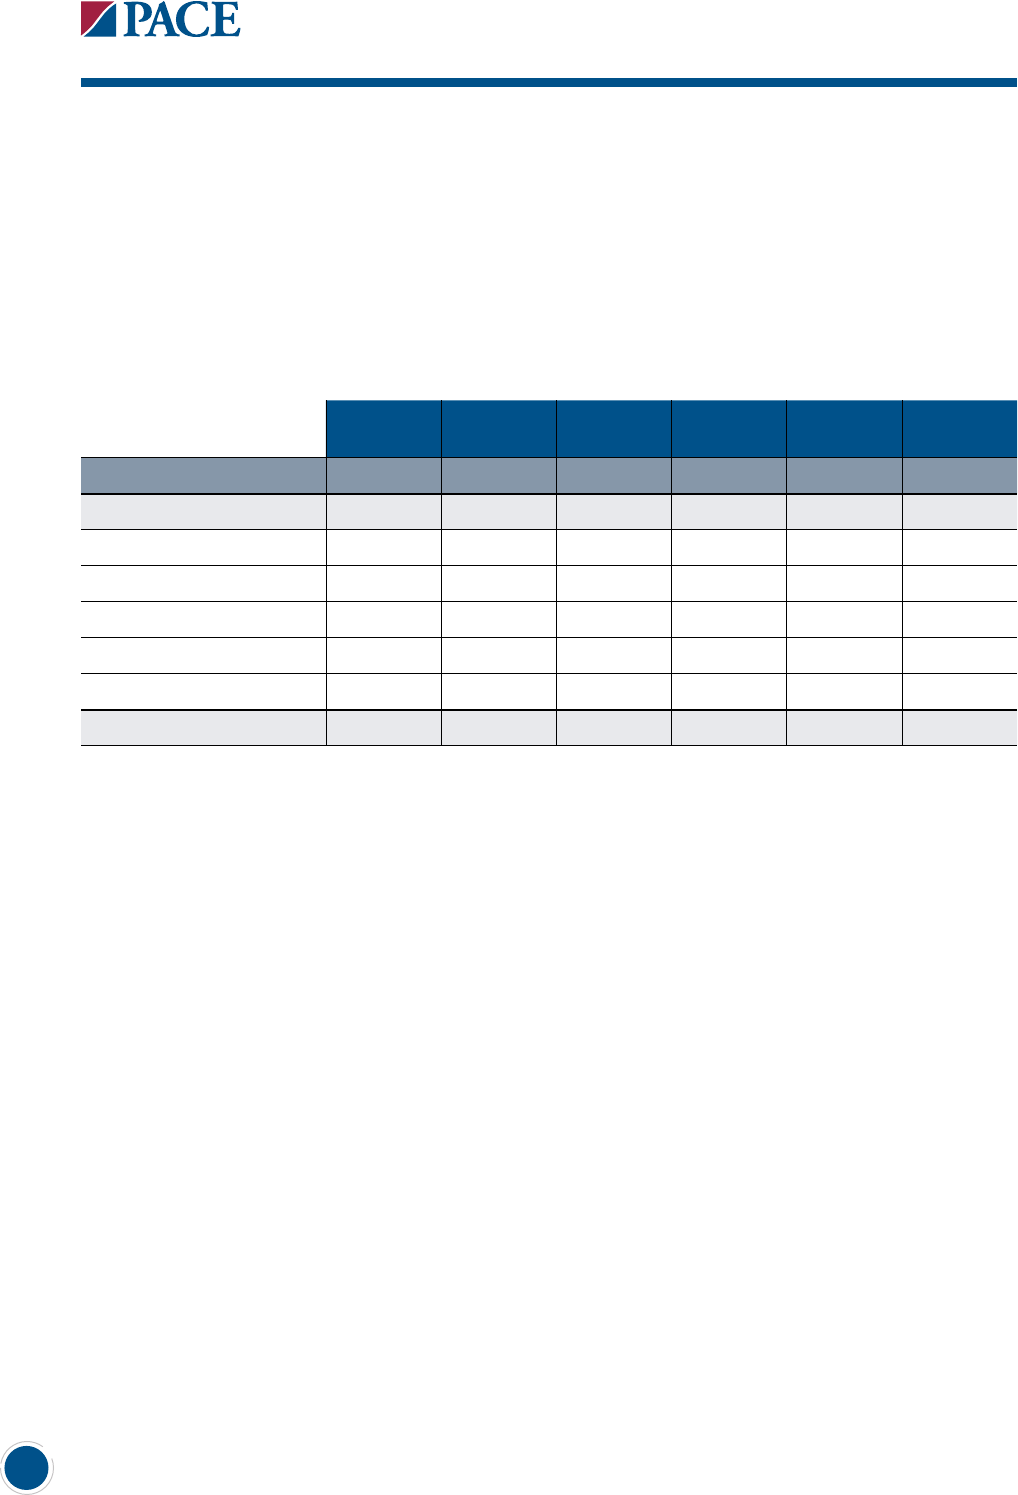
Of the students who attend an out-of-state four-year college, about 45% attend a
“broad-access” institution (defined as having an acceptance rate of 75% or higher), while
26% attend a selective institution (defined as having an acceptance rate below 50%). White
students are much more likely to enroll in colleges out-of-state compared to other racial/
ethnic groups.
Table 1: Out-of-State College Enrollment Rates of California Public High School Students,
by Student and College Characteristics
All Asian/PI
Black/
Af Am
Latino/a White SED
Out-of-State Enrollment 6.8% 7.4% 8.4% 2.9% 13.1% 2.8%
4-Year College 6.0% 7.0% 7.3% 2.3% 12.1% 2.1%
Acceptance Rate <25% 0.5% 1.5% 0.3% 0.1% 0.7% 0.1%
Acceptance Rate 25% - 50% 1.1% 1.7% 1.5% 0.4% 2.1% 0.4%
Acceptance Rate 50% - 75% 1.7% 2.1% 2.4% 0.6% 3.4% 0.6%
Acceptance Rate 75% - 99% 2.4% 1.5% 2.2% 0.9% 5.5% 0.7%
Non Selective Institution 0.3% 0.2% 1.0% 0.2% 0.4% 0.3%
2-Year or Less College 0.8% 0.4% 1.1% 0.6% 1.1% 0.7%

edpolicyinca.org
Policy Analysis for California Education
13
Conclusion
In recent years, nearly two-thirds of California’s high school graduates enrolled in
college within a year and a half of completing high school. Nationally, about 70% of high
school completers enrolled in college by the October immediately following high school
completion (National Center for Education Statistics, 2018). California boasts one of the
highest rates of two-year college enrollment among college-goers at 57%, compared with
the national rate of 43% (College Board, 2018). Substantial disparities in college enrollment
exist by student subgroups, particularly in some counties. Moreover, college destinations
remain highly stratified by student background (socioeconomic status and race/ethnicity).
California faces a critical need to produce more college graduates for an increasingly
complex labor market, and college enrollment is just one part of the solution (Johnson,
Cuellar Mejia, & Bohn, 2018). College completion rates remain low in both the open access
community colleges and the broad access state universities (CSU). A likely key culprit for the
low rates of college completion is a lack of alignment and coordination between California’s
K-12 and higher education systems, which leaves many students unprepared for college,
and many colleges ill-prepared to support students’ needs. This misalignment may be most
evident in the fact that there is no systematic tracking of students’ educational trajectories,
leaving educators without critical information regarding the outcomes of their students.
This portrait of college enrollment and college destinations for the census of
California public high school students is overdue; the last time California provided this
information was nearly a decade ago. Notwithstanding, the California Department of
Education continues to emphasize and invest in college and career readiness through
comprehensive eorts to reform college readiness standards, aligned assessments,
and accountability metrics such as the College/Career Indicator. Yet, in an era of
intense “college for all” ethos, the lack of regularly available information about students’
postsecondary trajectories makes it dicult for institutions to monitor outcomes and
make informed decisions. It also creates challenges for organizations seeking to promote
and improve college and career readiness.
Despite relatively high rates of college participation, important disparities by race/
ethnicity and other background characteristics exist in both overall enrollment and
in institutional destination types. This analysis does not provide explanations for these
disparities. From previous research, we know that college choice (including the decision to
apply and enroll, and where) is a function of a host of individual attributes (e.g., aspirations
and beliefs, academic preparation, college knowledge, fortitude and resilience), as well as
structural barriers (e.g., access to quality academic preparation, college information, and
financial constraints). In future work, we plan to examine a variety of inputs that may aect
the decision to enroll in college, where to enroll, and ultimately, college degree attainment.
Where California High School Students Attend College14
References
California Competes (2018). Out of the dark: Bringing California’s education data
into the 21st Century. Oakland: California Competes. Retrieved from: http://
californiacompetes.org/assets/general-files/CACompetes_Data-System-Brief_Final.pdf
College Board. (2018). Trends in college pricing 2018. Washington, D.C.: The College Board.
Retrieved from: https://trends.collegeboard.org/college-pricing/figures-tables/ten-
year-percentage-increase-total-public-enrollment-state
Dynarski, S. M., Hemelt, S. W., & Hyman, J. M. (2015). The missing manual: Using National
Student Clearinghouse data to track postsecondary outcomes. Educational
Evaluation and Policy Analysis, 37(1S), 53S-79S.
Johnson, H., Cuellar Mejia, M., & Bohn, S. (2015). Will California run out of college
graduates? San Francisco: The Public Policy Institute of California. Retrieved from:
http://www.ppic.org/content/pubs/report/R_1015HJR.pdf
Phillips, M., Reber, S., & Rothstein. J. (2018). Making California data more useful for
educational improvement. Palo Alto: Policy Analysis for California. Retrieved from:
https://gettingdowntofacts.com/publications/making-california-data-more-useful-
educational-improvement-0
U.S. Department of Education, National Center for Education Statistics. (2017). Table 302.30:
Percentage of recent high school completers enrolled in college, by income level:
1975 through 2016. In U.S. Department of Education, National Center for Education
Statistics (Ed.), Digest of Education Statistics (2017 ed).

edpolicyinca.org
Policy Analysis for California Education
15
Author Biographies
Michal Kurlaender is Professor of Education Policy at the University of California, Davis,
and Faculty Co-Director of Policy Analysis for California Education. Kurlaender investigates
students’ educational pathways, in particular K-12 and postsecondary alignment, and
access to and success in college. Kurlaender works closely with all three of California’s
public higher education sectors—the University of California, the California State University
and the California Community College systems.
Sherrie Reed serves as Executive Director for California Education Lab located in the
School of Education at the University of California, Davis. Her research interests include
education policy, specifically accountability, charter schools, school finance, college
readiness, and career technical education. Prior to her role with UC Davis, Reed worked in
K-12 education as a teacher, administrator and charter school developer for over 20 years.
Kramer Cohen is a Ph.D. candidate in the Department of Economics at the University
of California, Davis. Her research interests include the economics of education and labor
economics, with a particular interest in college readiness, educational eectiveness,
and the eect of educational systems on historically underrepresented students. Prior
to attending UC Davis, Kramer was a research associate at the Public Policy Institute of
California and taught at San Francisco State University.
Matt Naven is a Ph.D. candidate in the Department of Economics at the University of
California, Davis. His primary research interests are public economics and the economics
of education, with particular interest in increasing college access for low-income students.
Paco Martorell is Associate Professor in the School of Education at the University of
California, Davis. His work is in the economics of education, with a focus on financial aid,
developmental education, the eects of grade retention, the returns to for-profit colleges,
and the impacts of school facility investments. Prior to joining the faculty at UC Davis,
Martorell was an Economist at the RAND Corporation and a professor at the Pardee RAND
Graduate School.
Scott Carrell is Professor of Economics at the University of California, Davis. His primary
area of research is in the economics of education and current projects include an
investigation of the role of faculty interactions in student academic success, measuring
school quality under both past and current assessment contexts in California. Carrell is a
retired U.S. Air Force ocer and previously taught at Dartmouth College and the U.S. Air
Force Academy.
Stanford Graduate School of Education
520 Galvez Mall, CERAS 401
Stanford, CA 94305-3001
Phone: (650) 724-2832
Fax: (650) 723-9931
edpolicyinca.org
About
Policy Analysis for California Education (PACE) is an independent,
non-partisan research center led by faculty directors at Stanford University,
the University of Southern California, the University of California Davis, the
University of California Los Angeles, and the University of California Berkeley.
PACE seeks to define and sustain a long-term strategy for comprehensive
policy reform and continuous improvement in performance at all levels
of California’s education system, from early childhood to postsecondary
education and training. PACE bridges the gap between research and policy,
working with scholars from California’s leading universities and with
state and local policymakers to increase the impact of academic research on
educational policy in California.
Founded in 1983, PACE
• Publishes policy briefs, research reports, and working papers that address
key policy issues in California’s education system.
• Convenes seminars and briefings that make current research accessible
to policy audiences throughout California.
• Provides expert testimony on educational issues to legislative committees
and other policy audiences.
• Works with local school districts and professional associations on projects
aimed at supporting policy innovation, data use, and rigorous evaluation.
